Systemic BiomarkerIn Validation
Cardiovascular Risk from Retina
27.58 mg/dL
MAE (Total cholesterol)
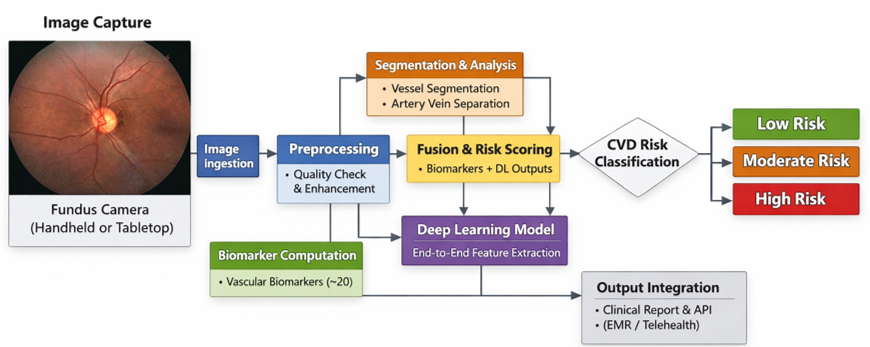
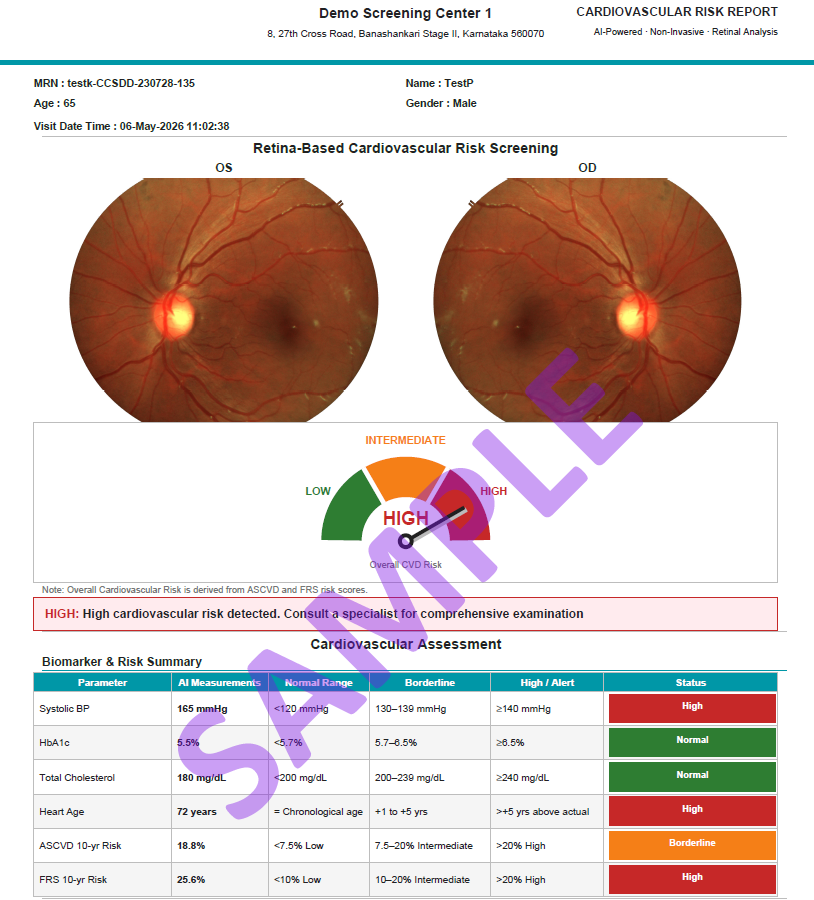
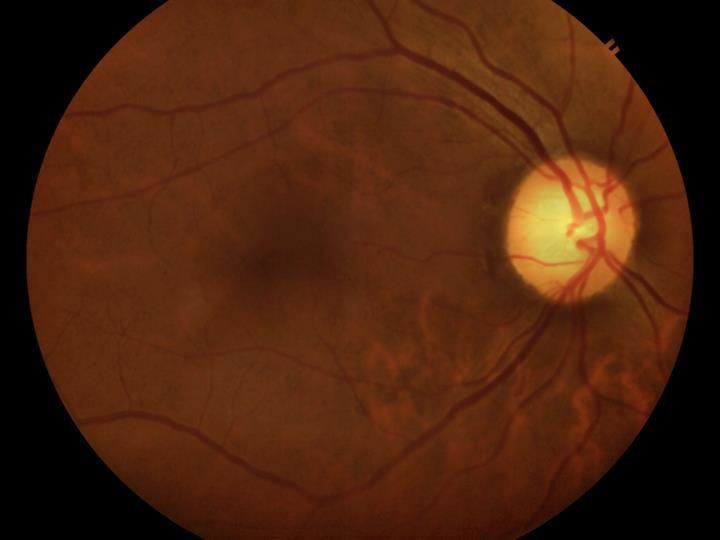
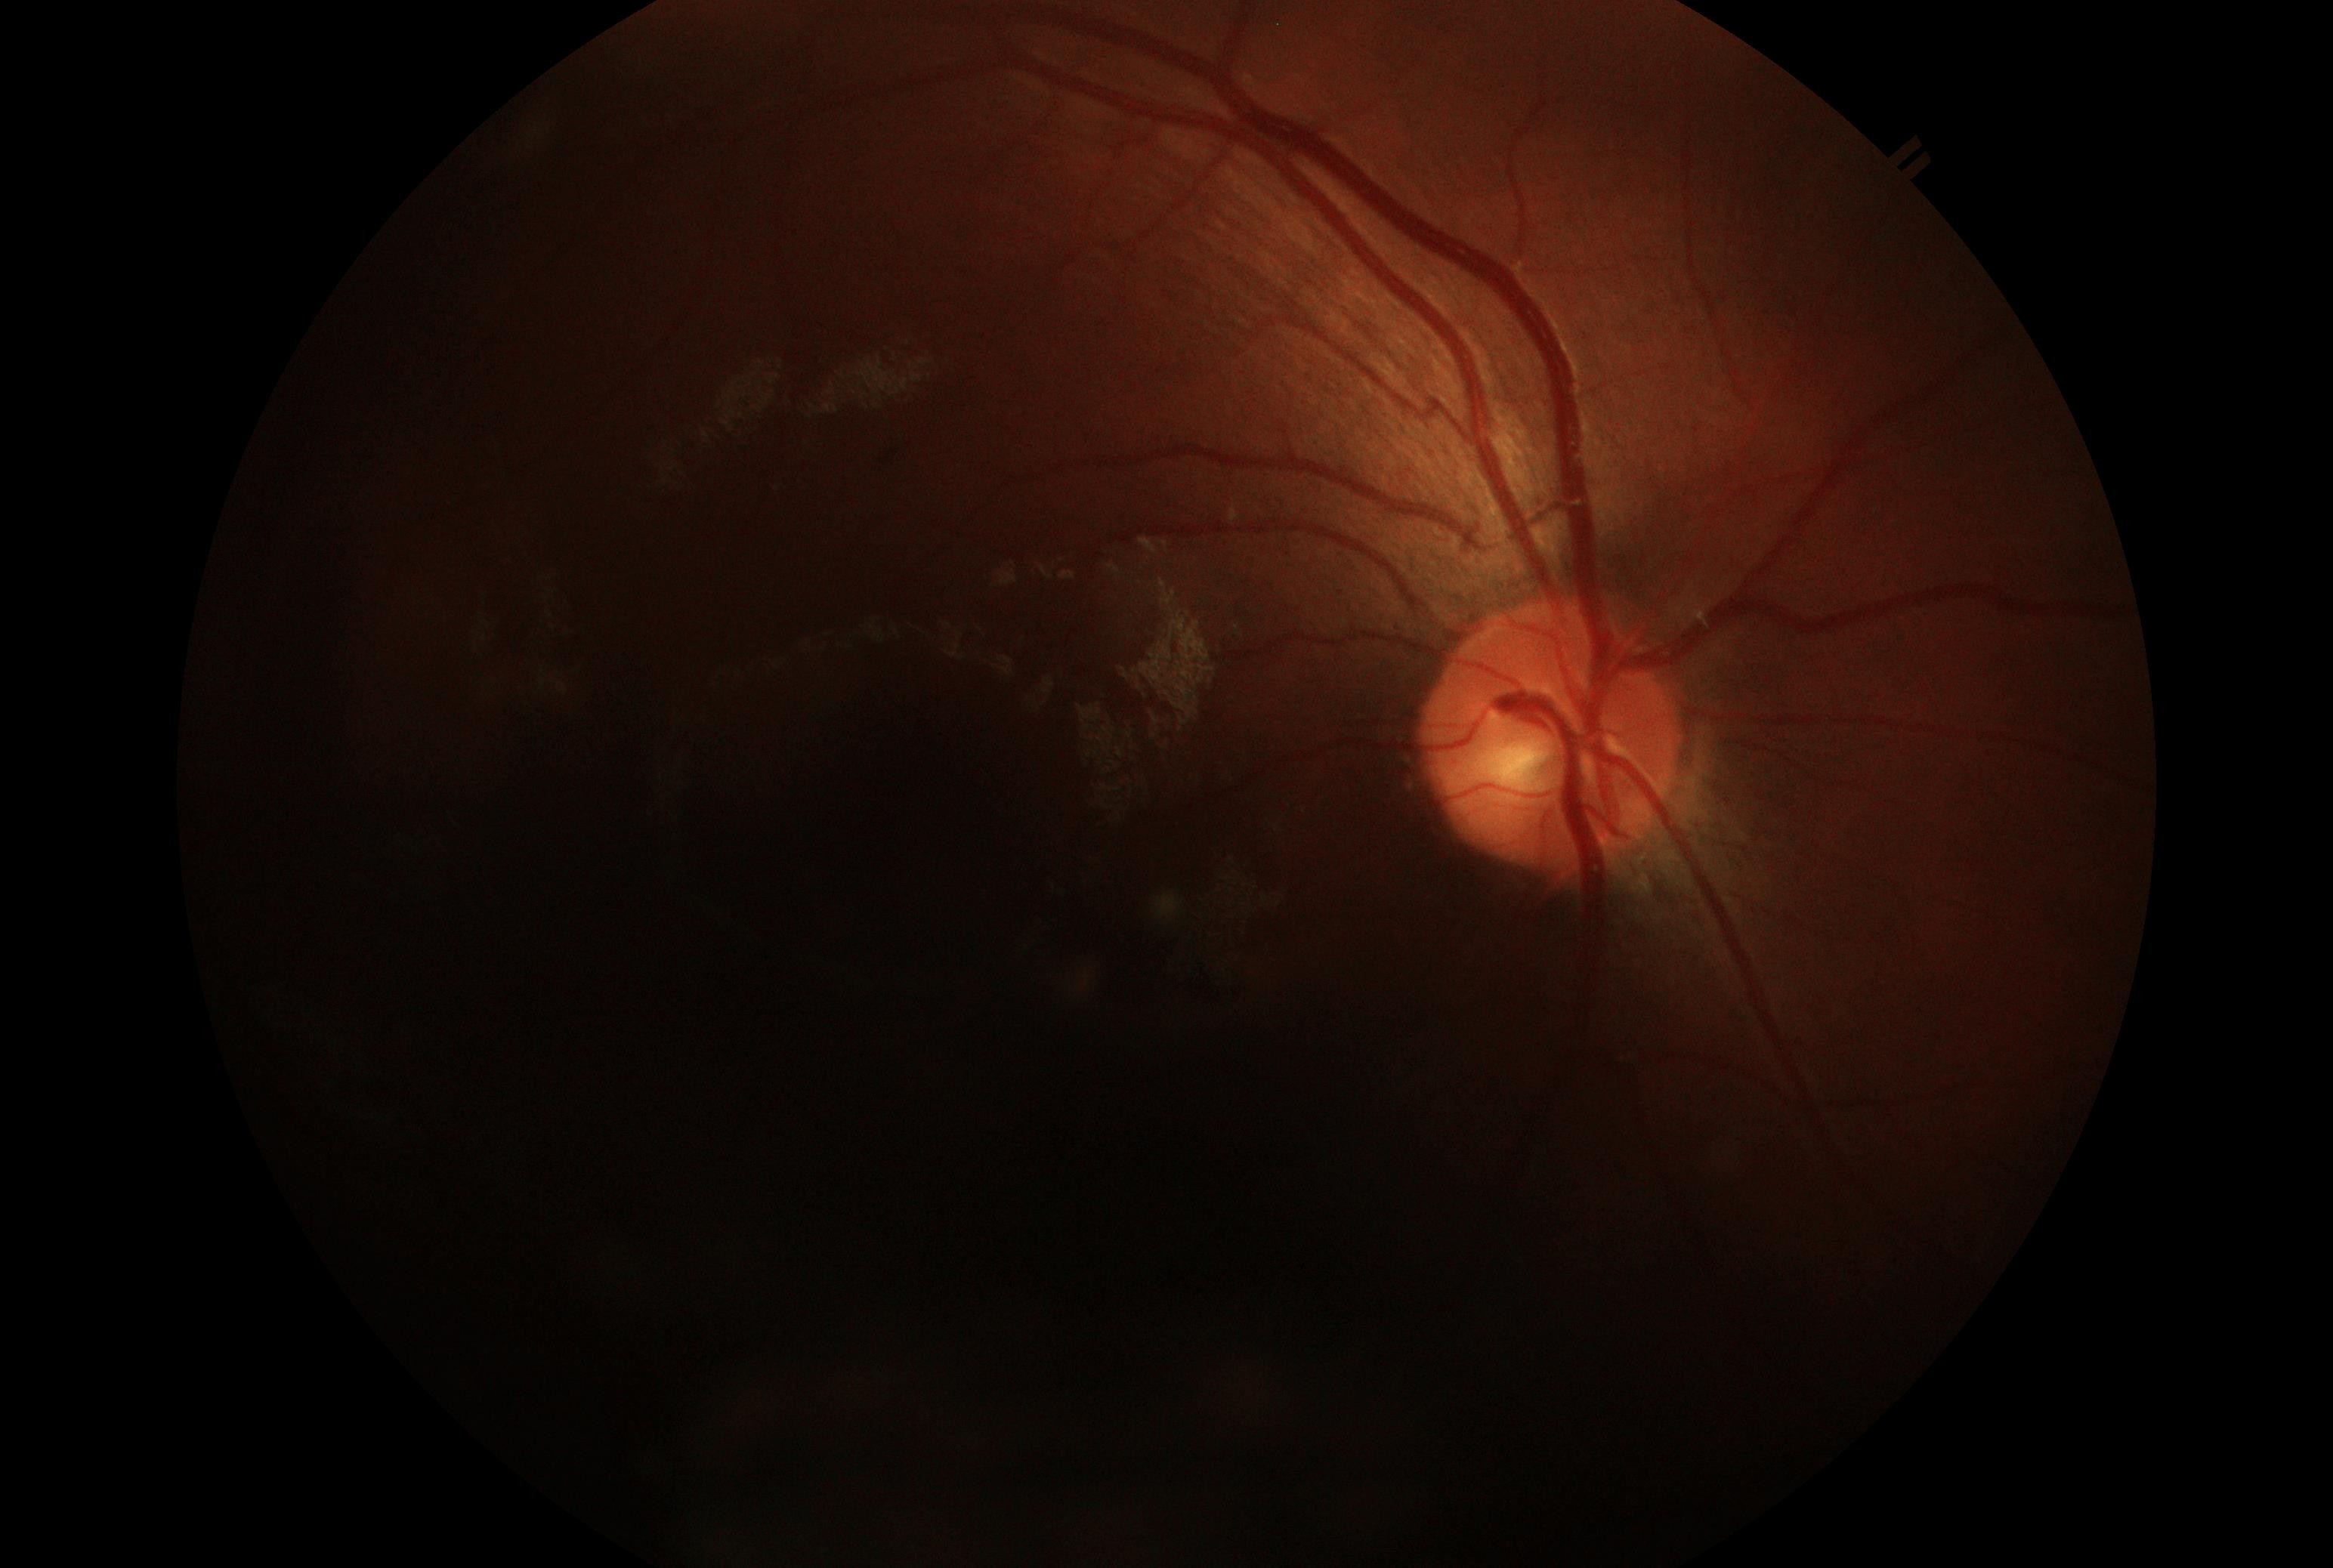
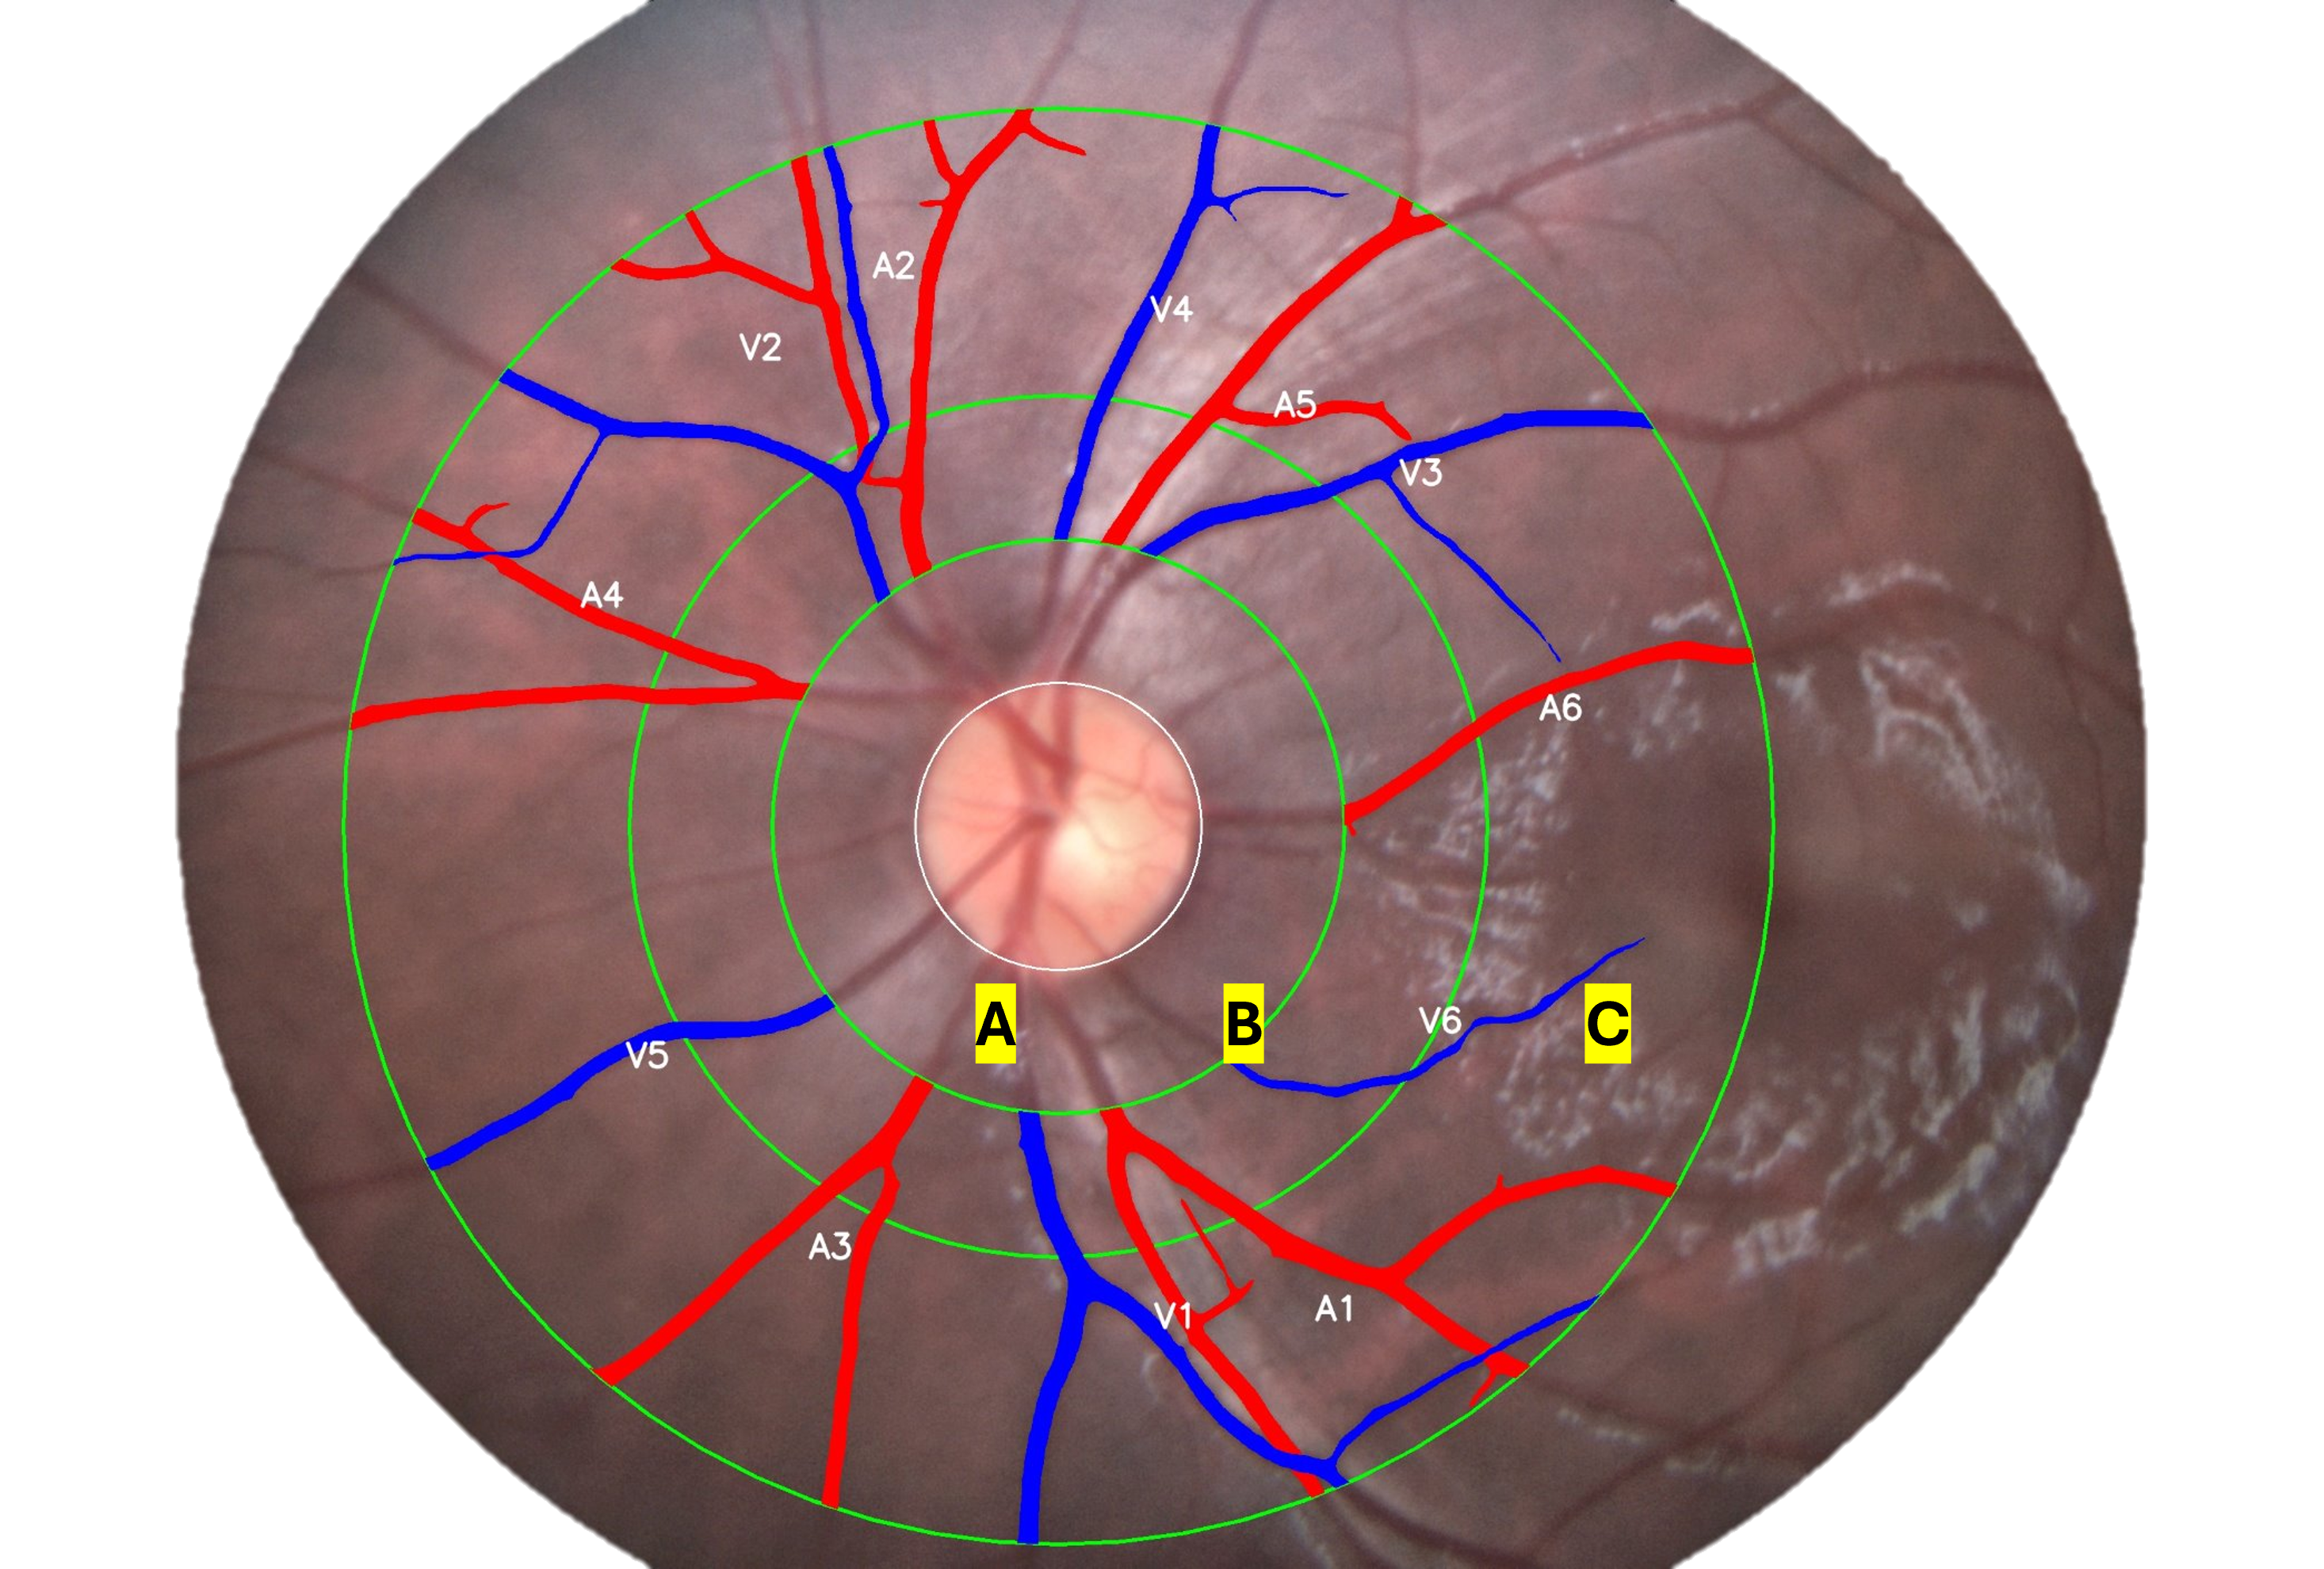
One of our most advanced AI solutions, it predicts 10-year risk for CVD, aligned with clinically
established Framingham's Risk Score (FRS) and (Atherosclerotic Cardiovascular Disease) ASCVD. Leverages
retinal vascular geometry - fractal dimension, arteriovenous nicking, vessel tortuosity, caliber asymmetry -
as surrogate markers for CVD risk. Using these, our AI system estimates systemic biomarkers including
SysBP, HbA1c, total cholesterol and heart age. Composite cardiovascular risk score is generated from
non-invasive fundus images, without any blood draw or ECG.
Vascular geometryMulti-ethnic
validationSaMDSystolic BPHBA1cTotal CholesterolFRSASCVDAV nicking
Retinal SegmentIn Validation
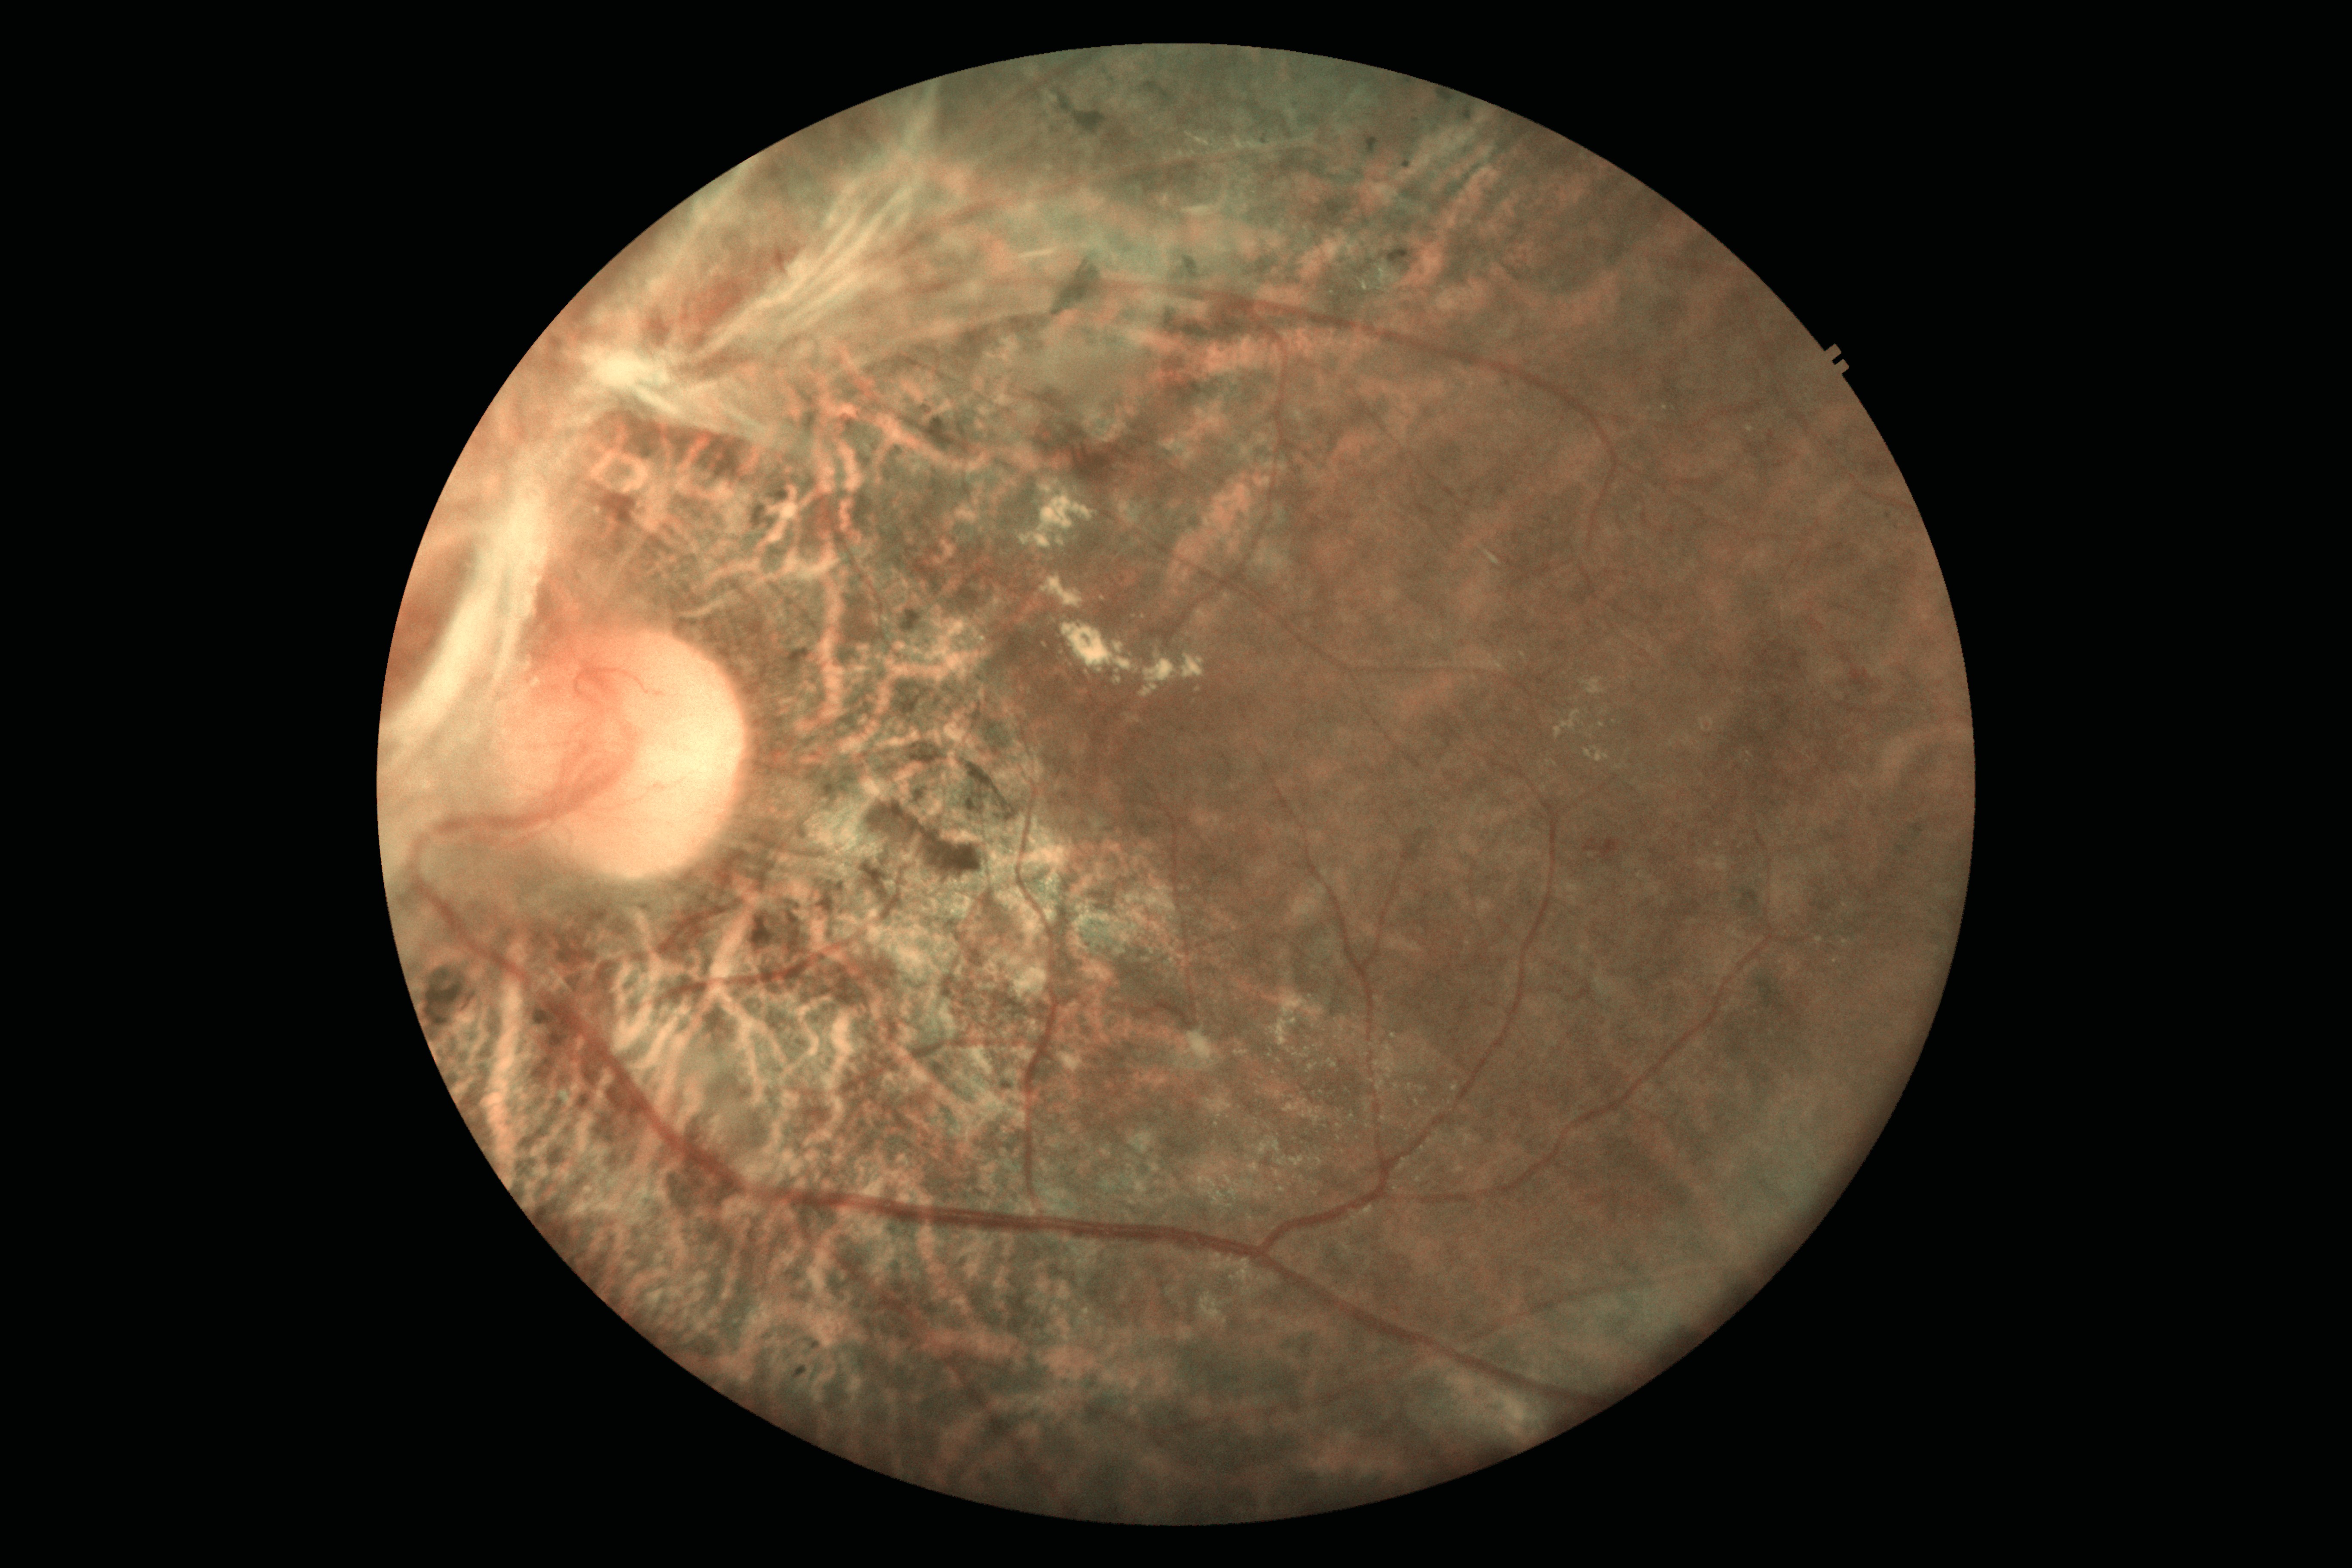
Retinopathy of Prematurity (ROP-AI)
97%
Specificity (ridge detection)
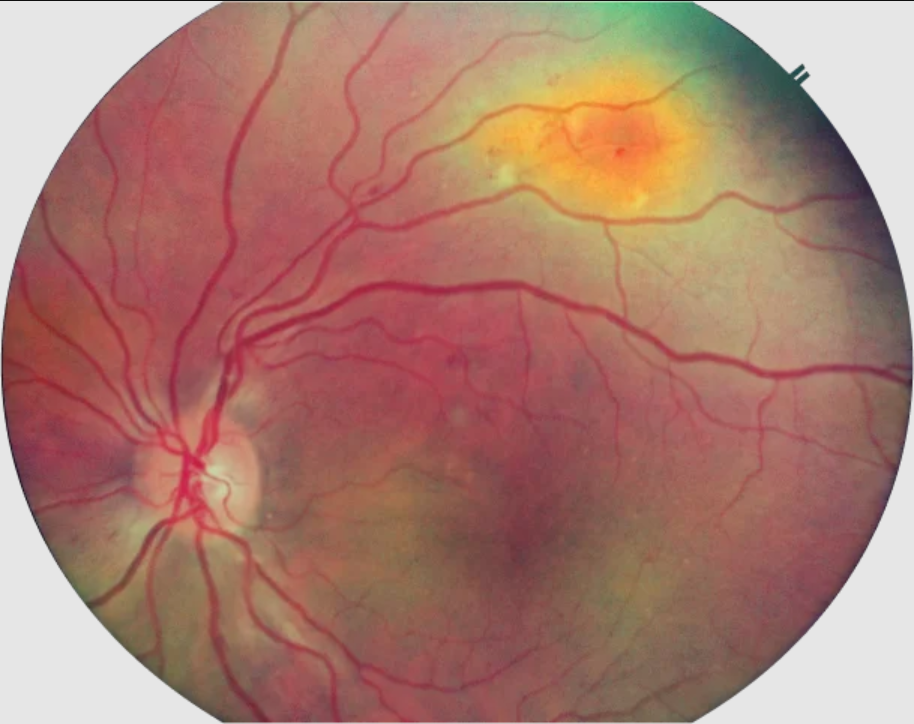
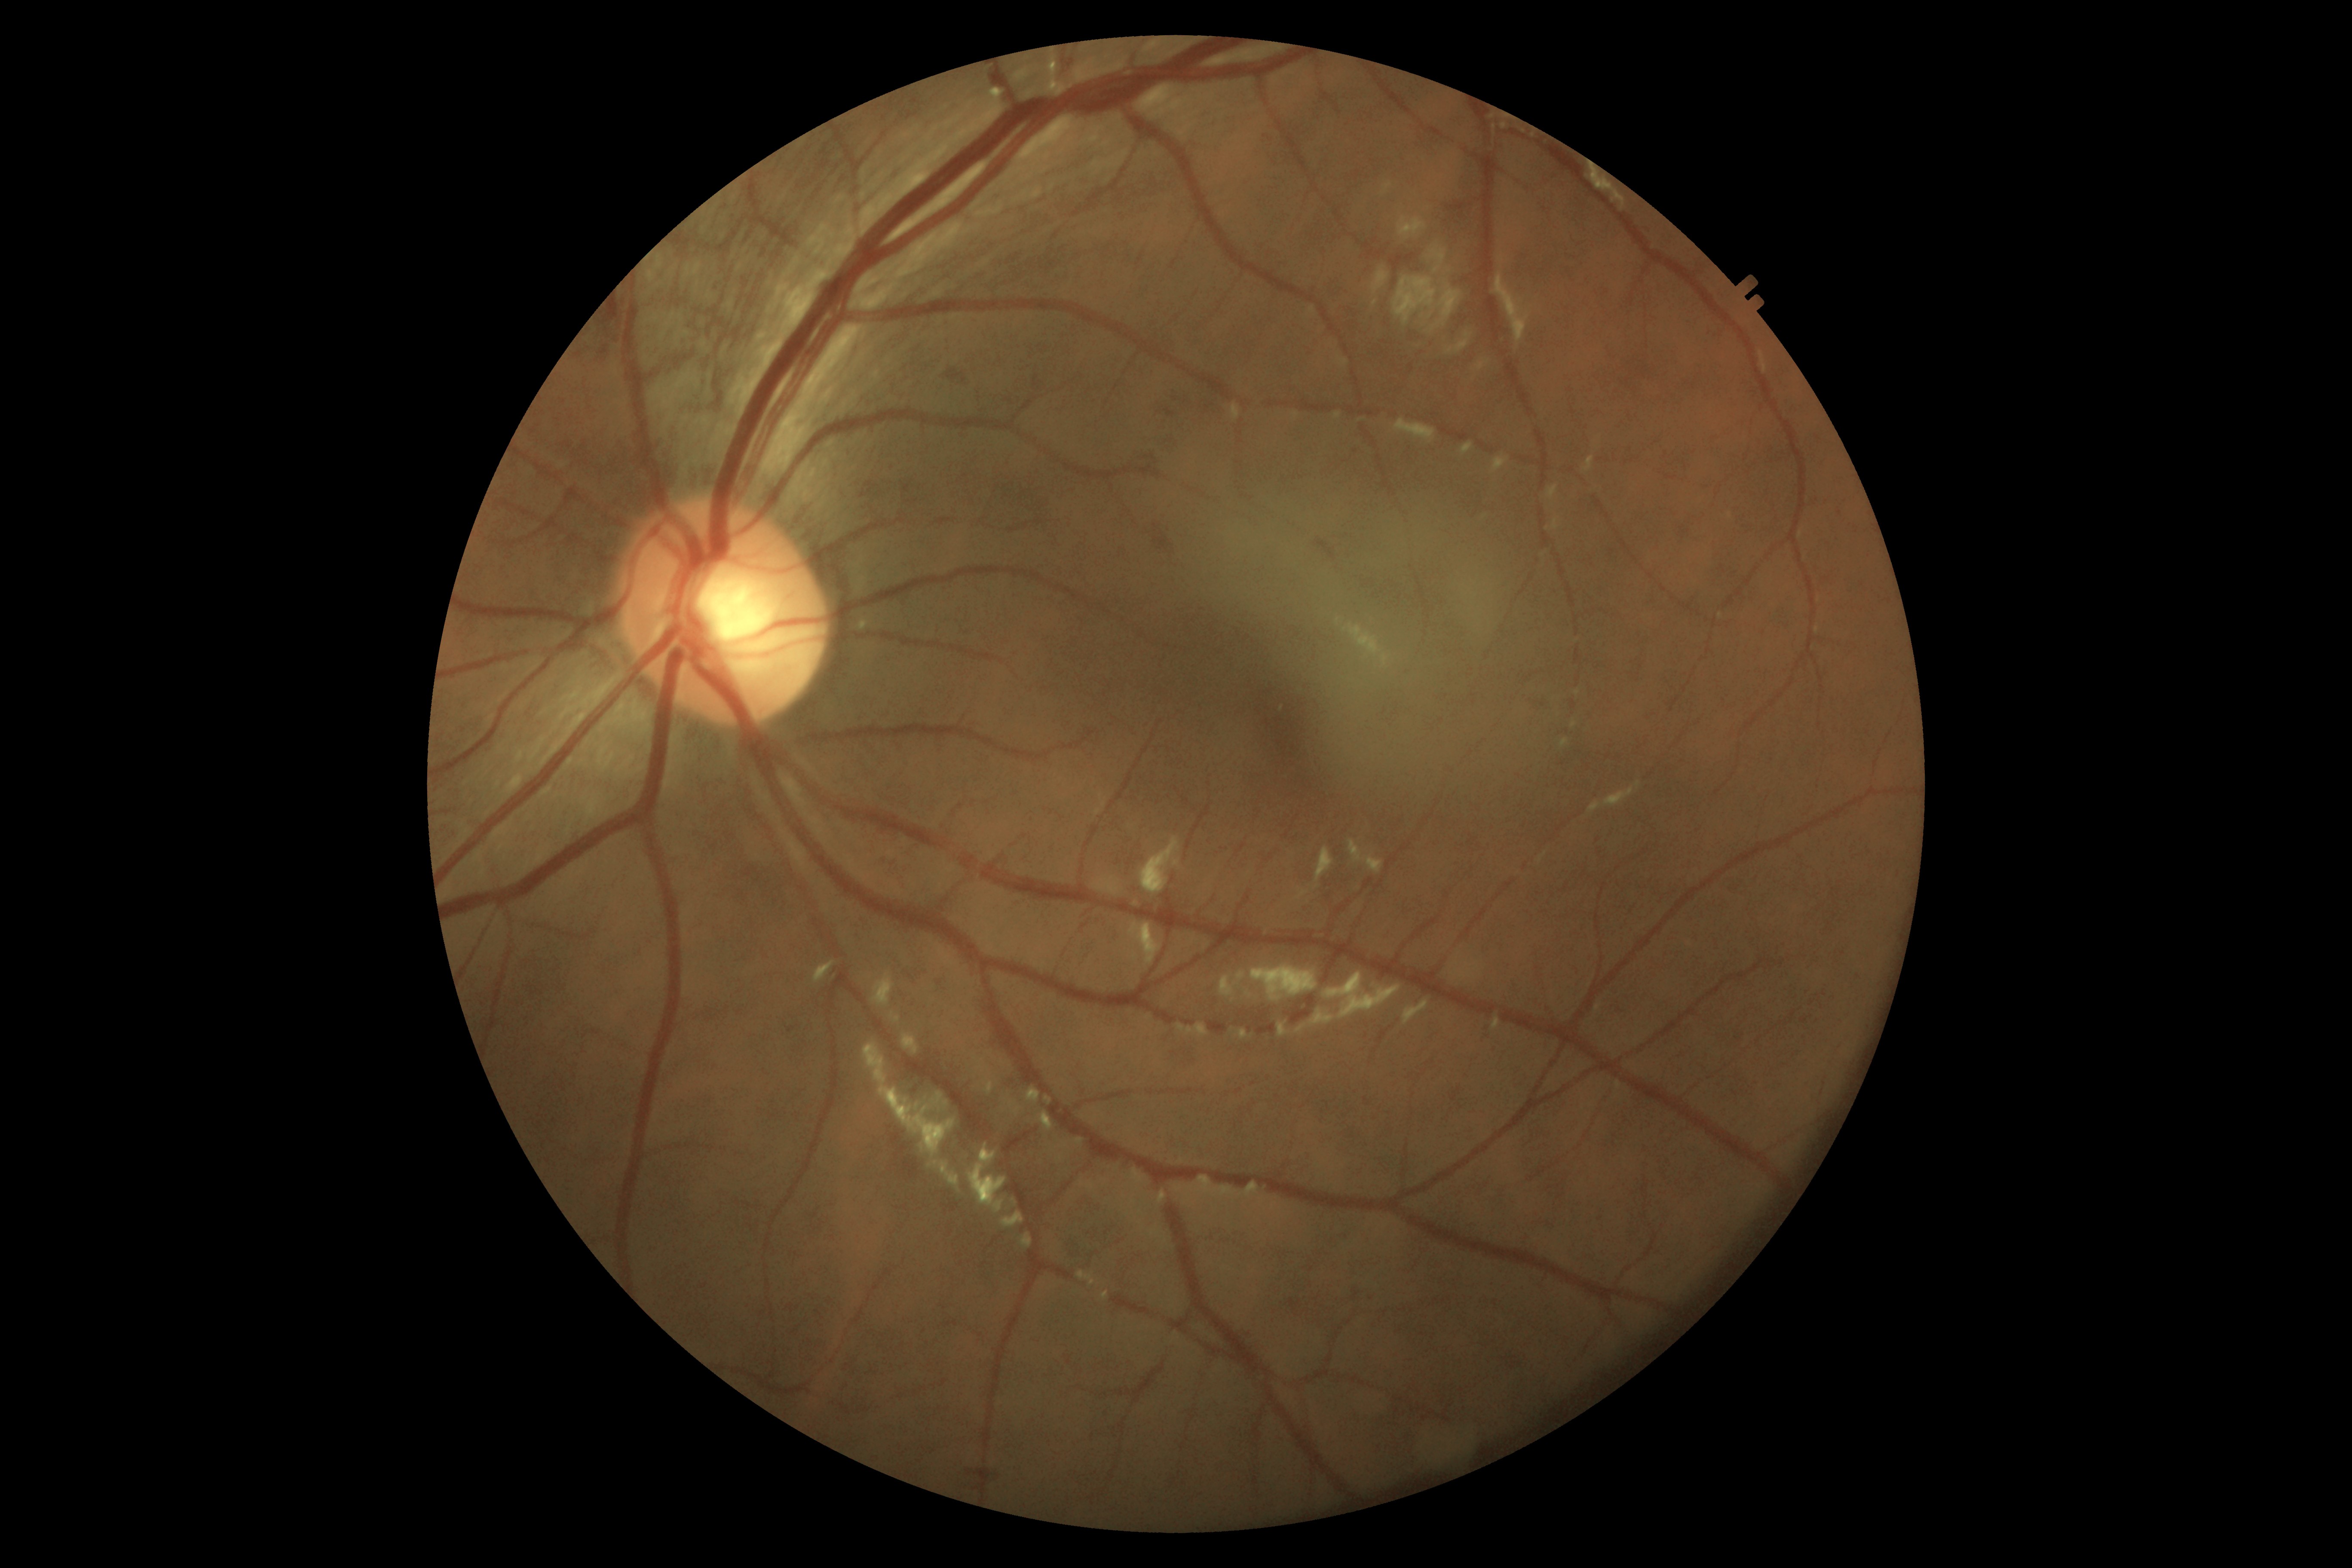
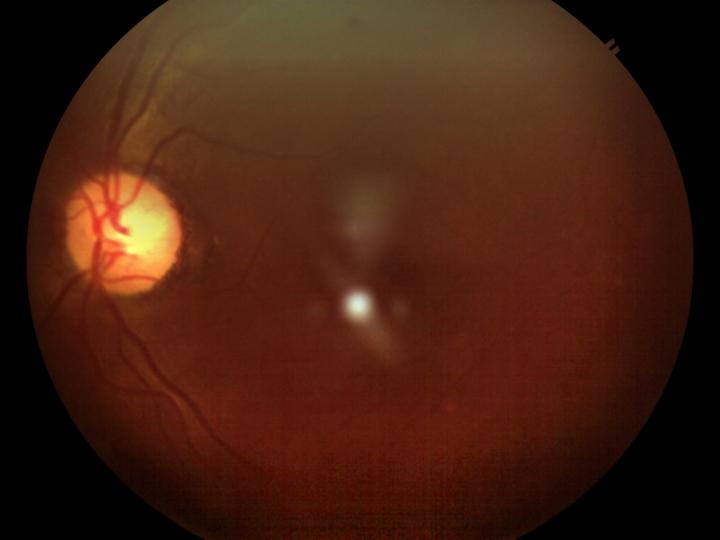
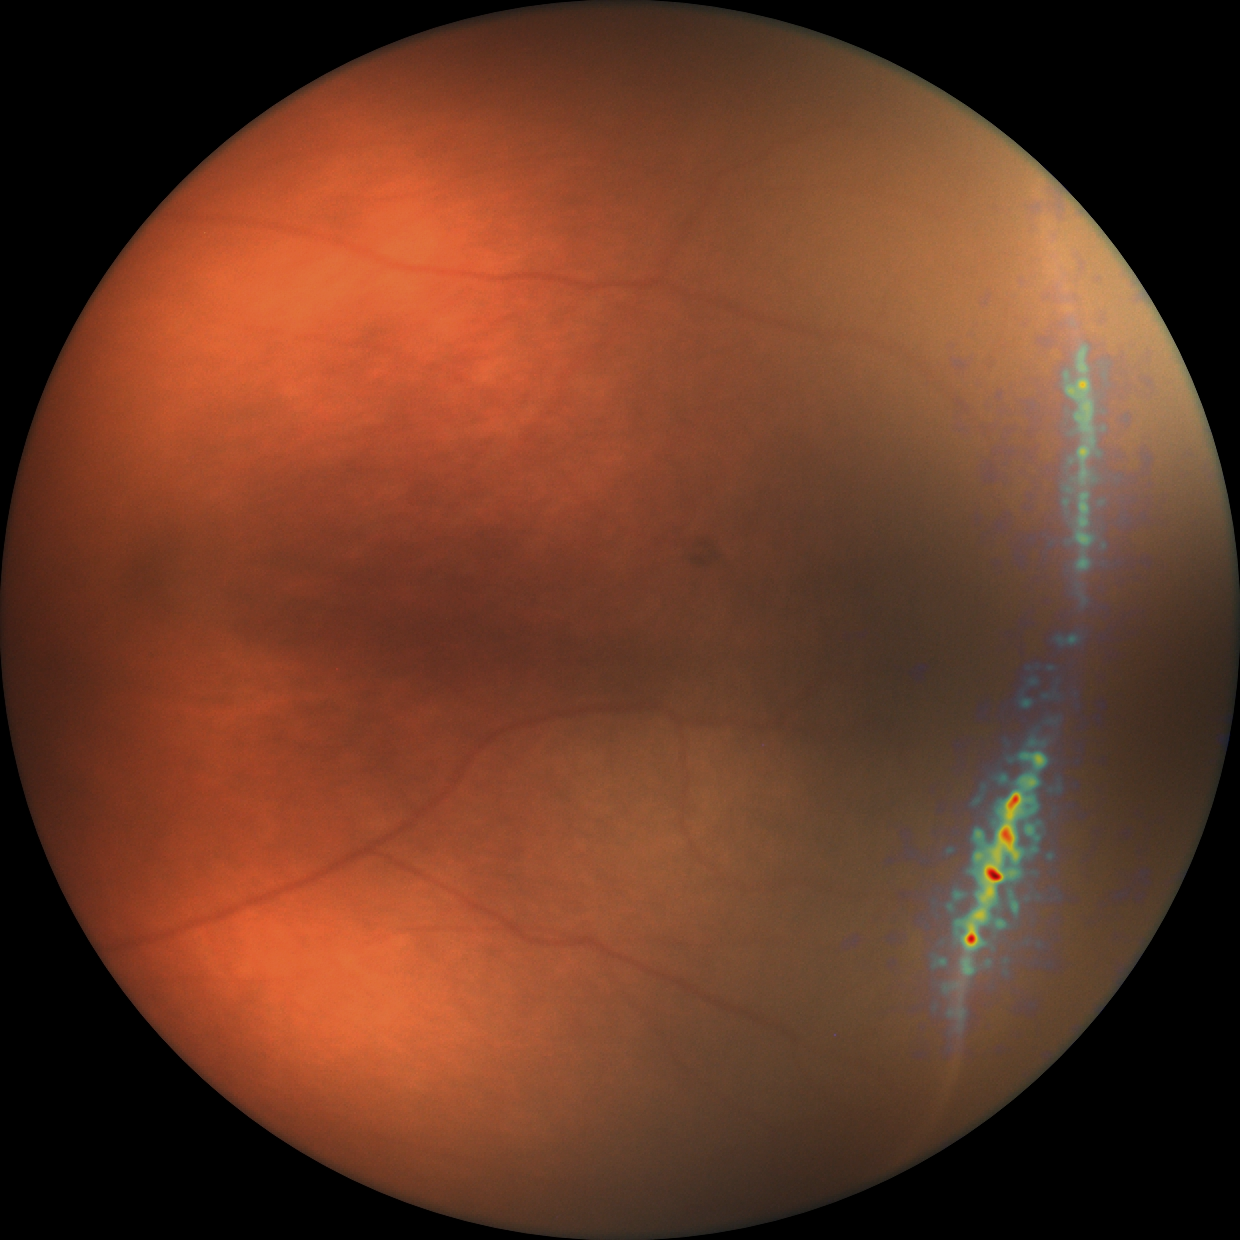
Employs sophisticated deep learning models to instantly evaluate multiple images of the neonatal retina,
classifying its severity across clinical stages (1, 2, 3 and above) and identifying it's Zone (I, II, or
III) with expert-level accuracy. By meticulously analyzing vascular dilation and tortuosity at the
posterior pole, the AI also quantifies and characterizes Plus and Pre-plus disease markers - the critical
drivers of treatment decisions. This fast and objective, characterization empowers clinical teams with
reliable, decision-ready insights when every second counts to protect a newborn's vision.
SaMDROP StageROP
ZonePlus conditionPre-Plus conditionConvNextAttention-based Network
Retinal SegmentDeployedCDSCO Class C Approved
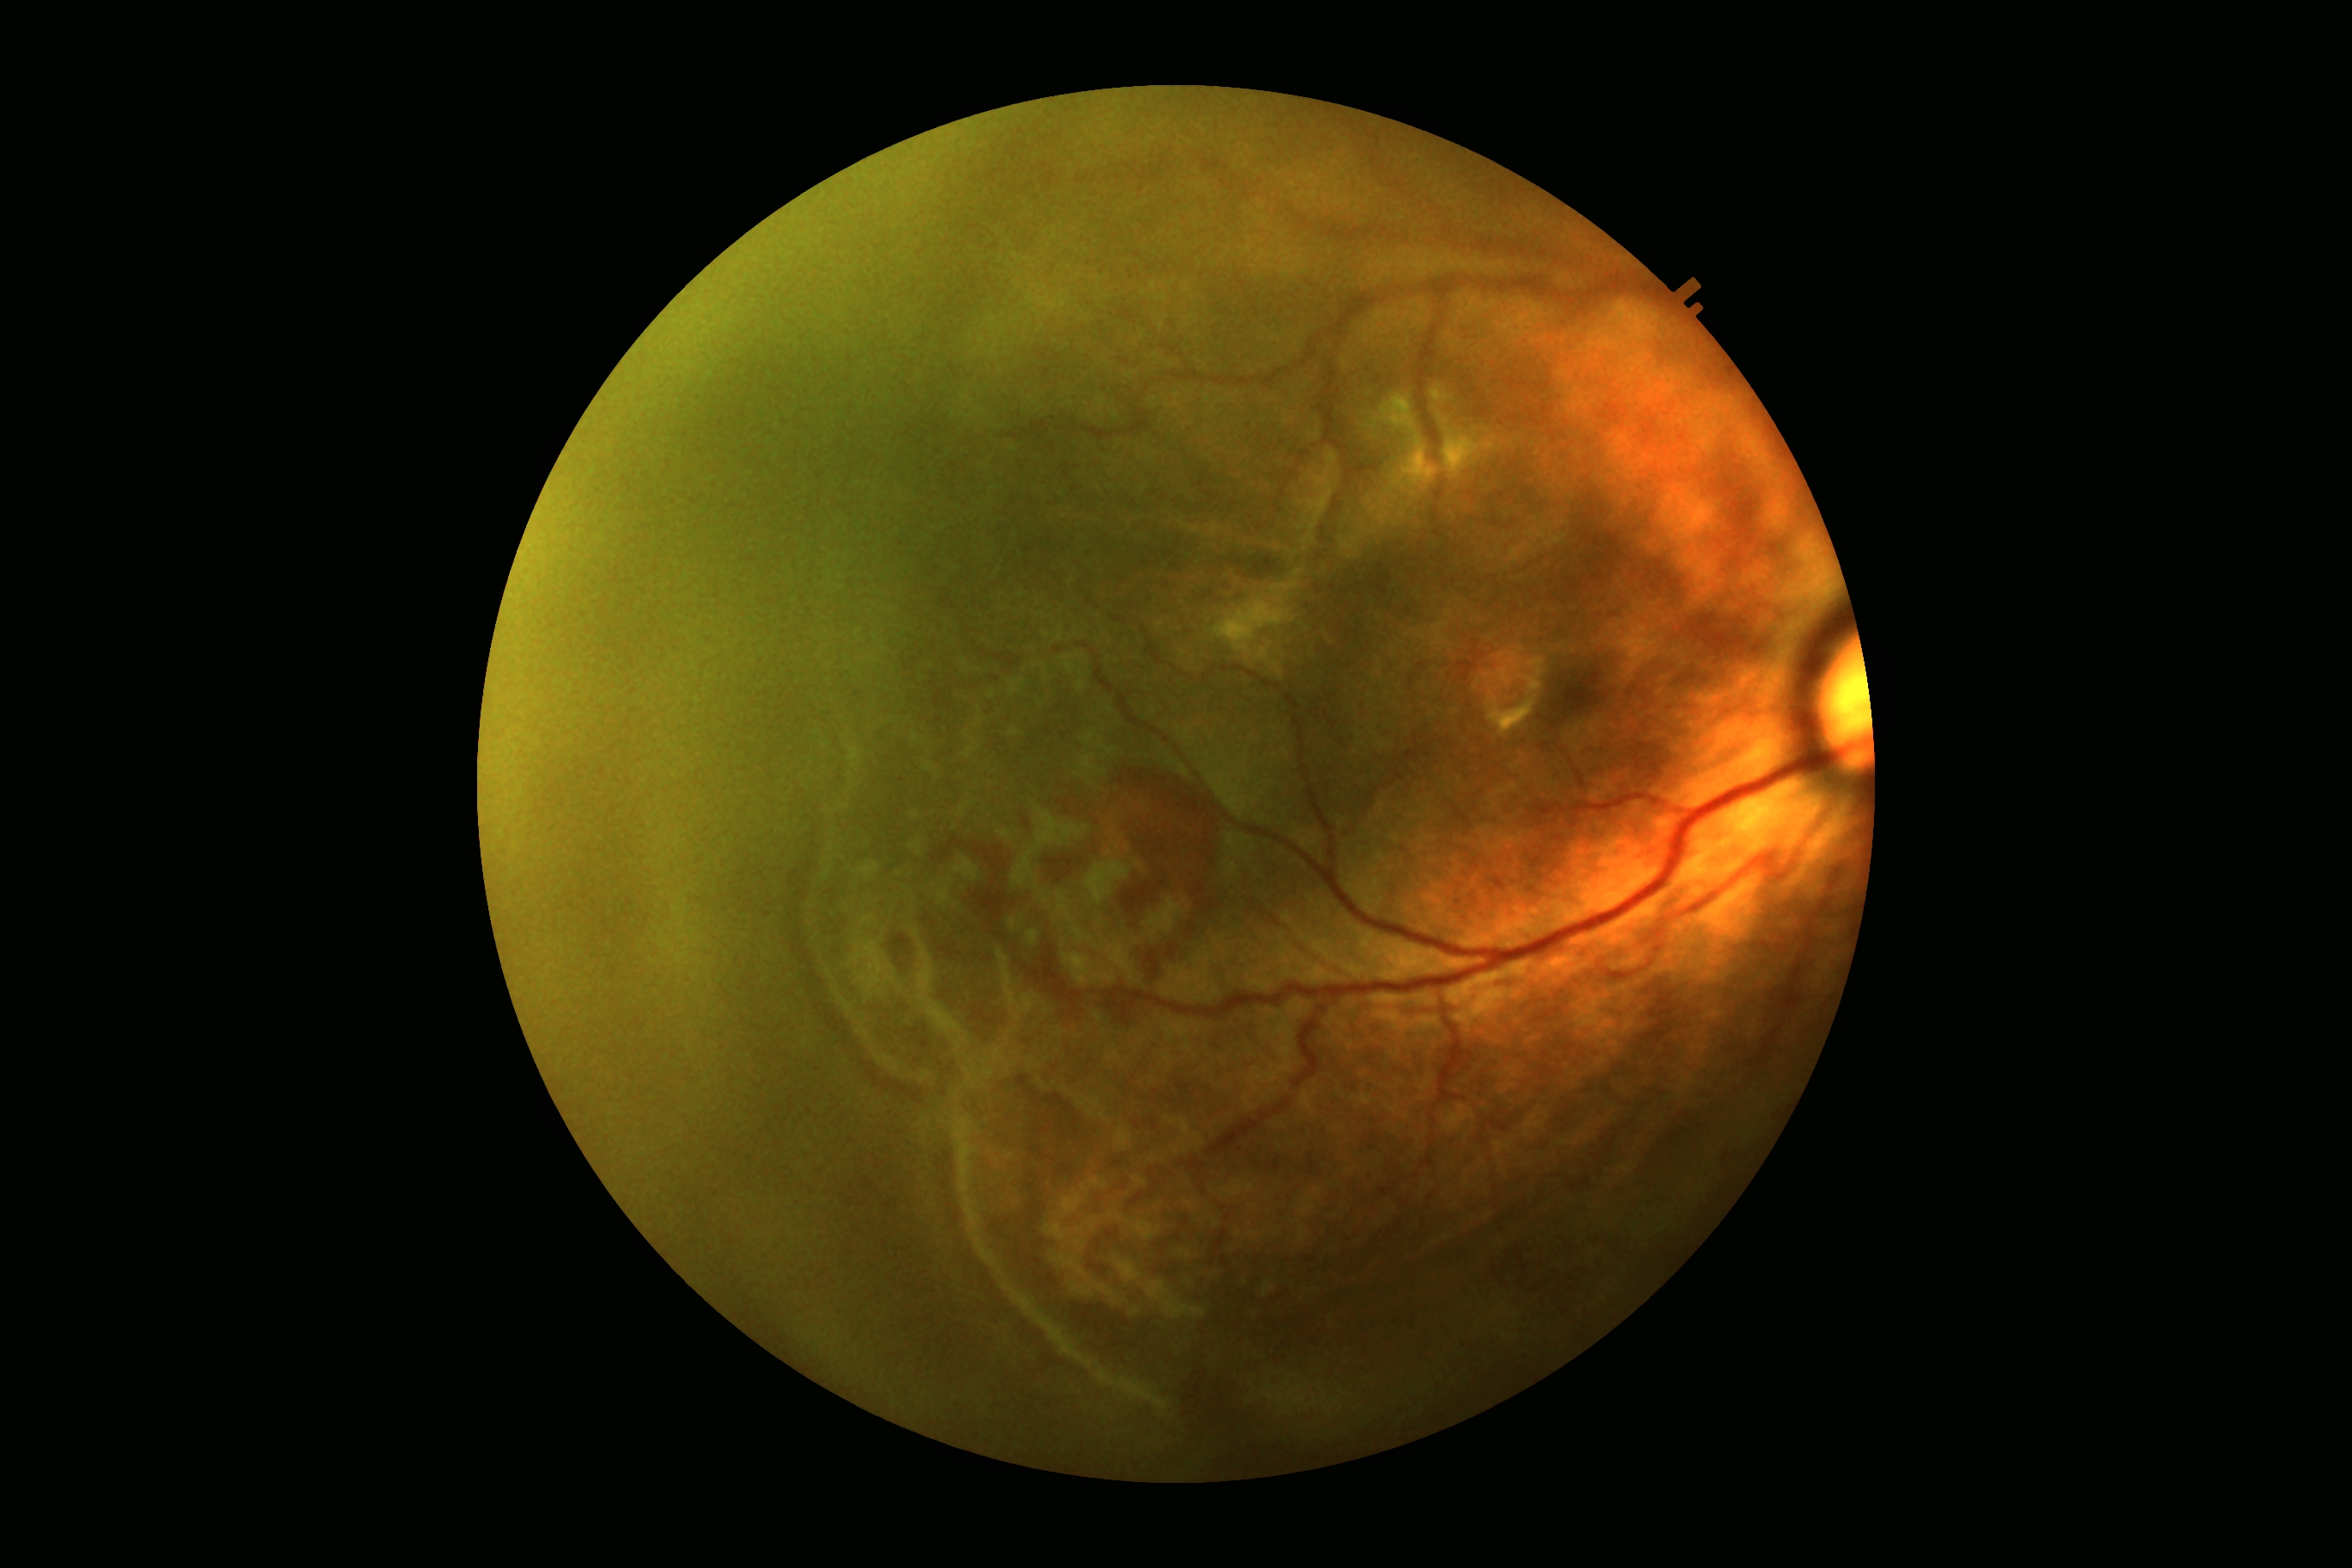
Diabetic Retinopathy Grading
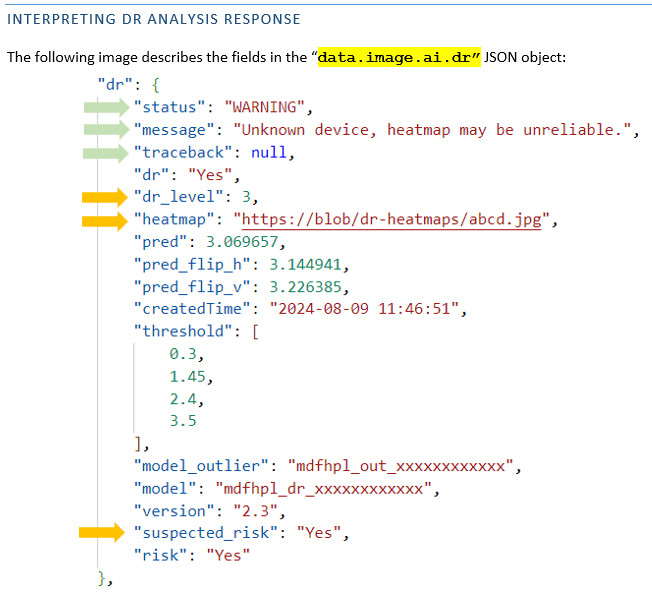
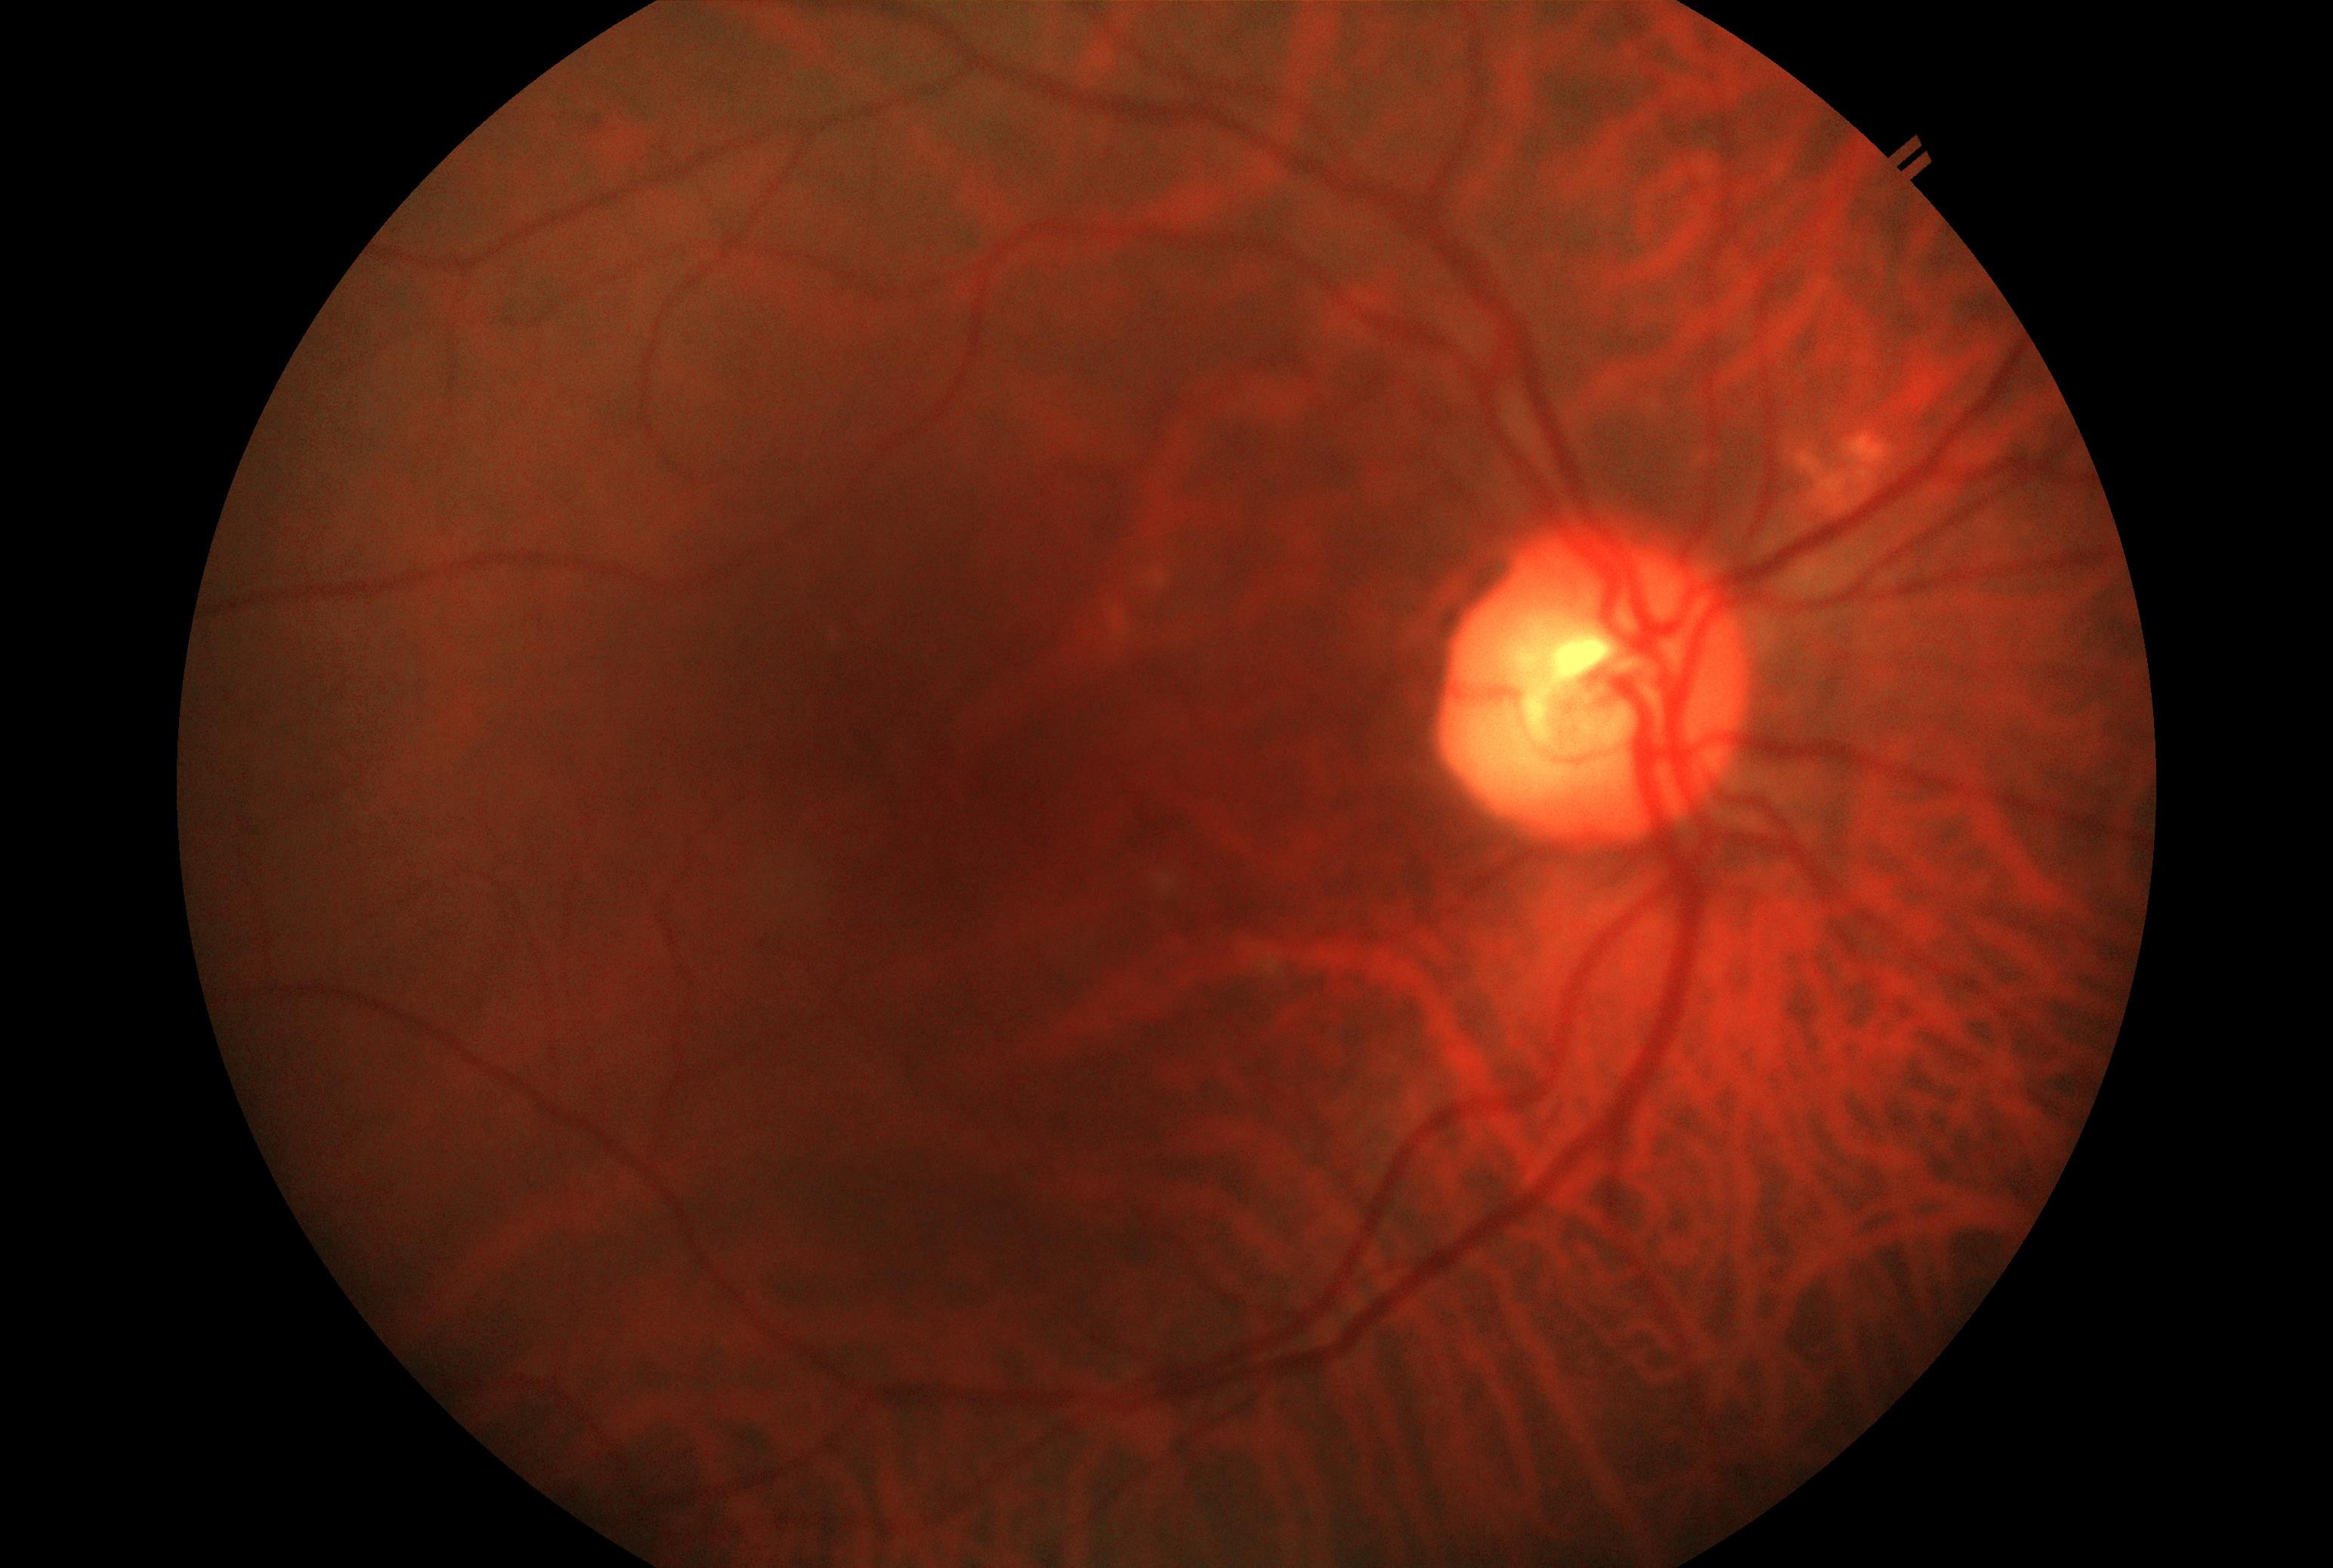
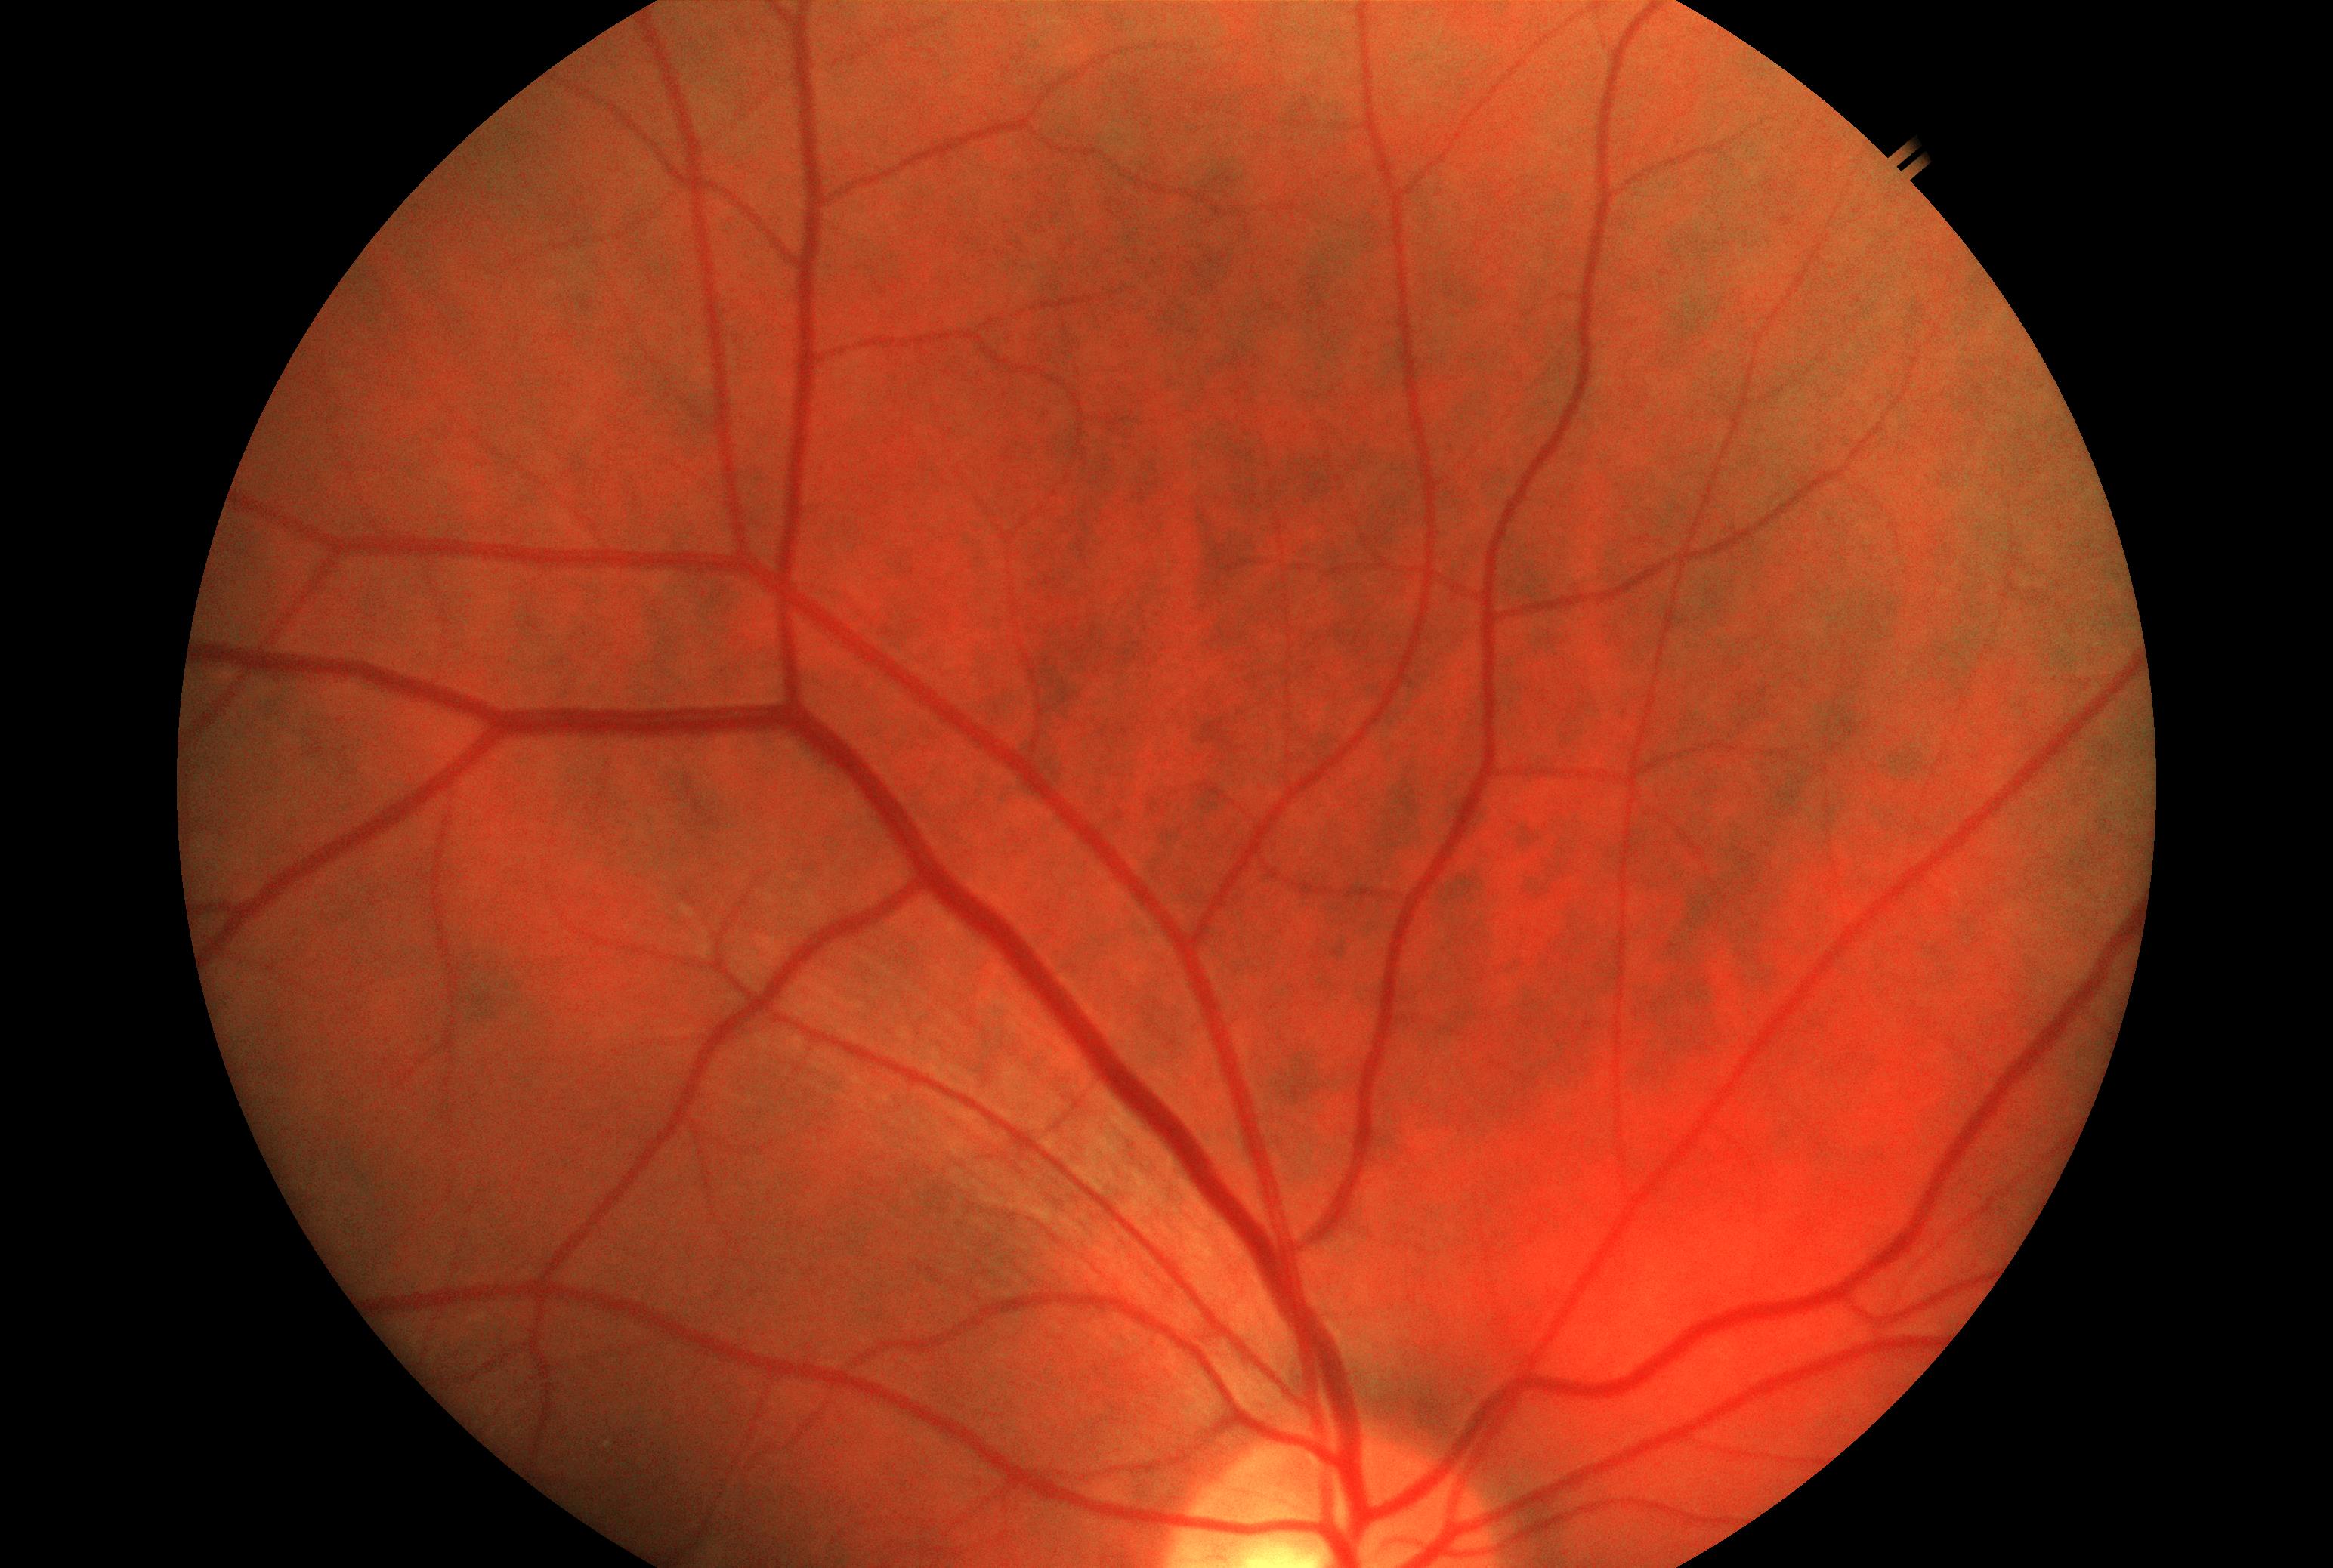
Trained on a large corpus of real-world retinal images, our advanced deep CNN-based classifier ensures
robust clinical performance. The system looks for clinically relevant biomarkers for DR - including
microaneurysms, hemorrhages, exudates, and neovascularization - with a specialized focus on identifying
early-stage DR. By mapping findings to the ICDR 5-class severity scale, the AI delivers an immediate,
actionable output of referable versus non-referable cases to streamline clinical triage. The assessment is
further enhanced by intuitive heatmaps that visually localize lesions, when detected.
EfficientNet-B4Multi-class
classificationGrad-CAMSaMDCDSCO ApprovedMild NPDR indication
Retinal SegmentDeployedCDSCO Test License
Glaucoma Analysis Tools
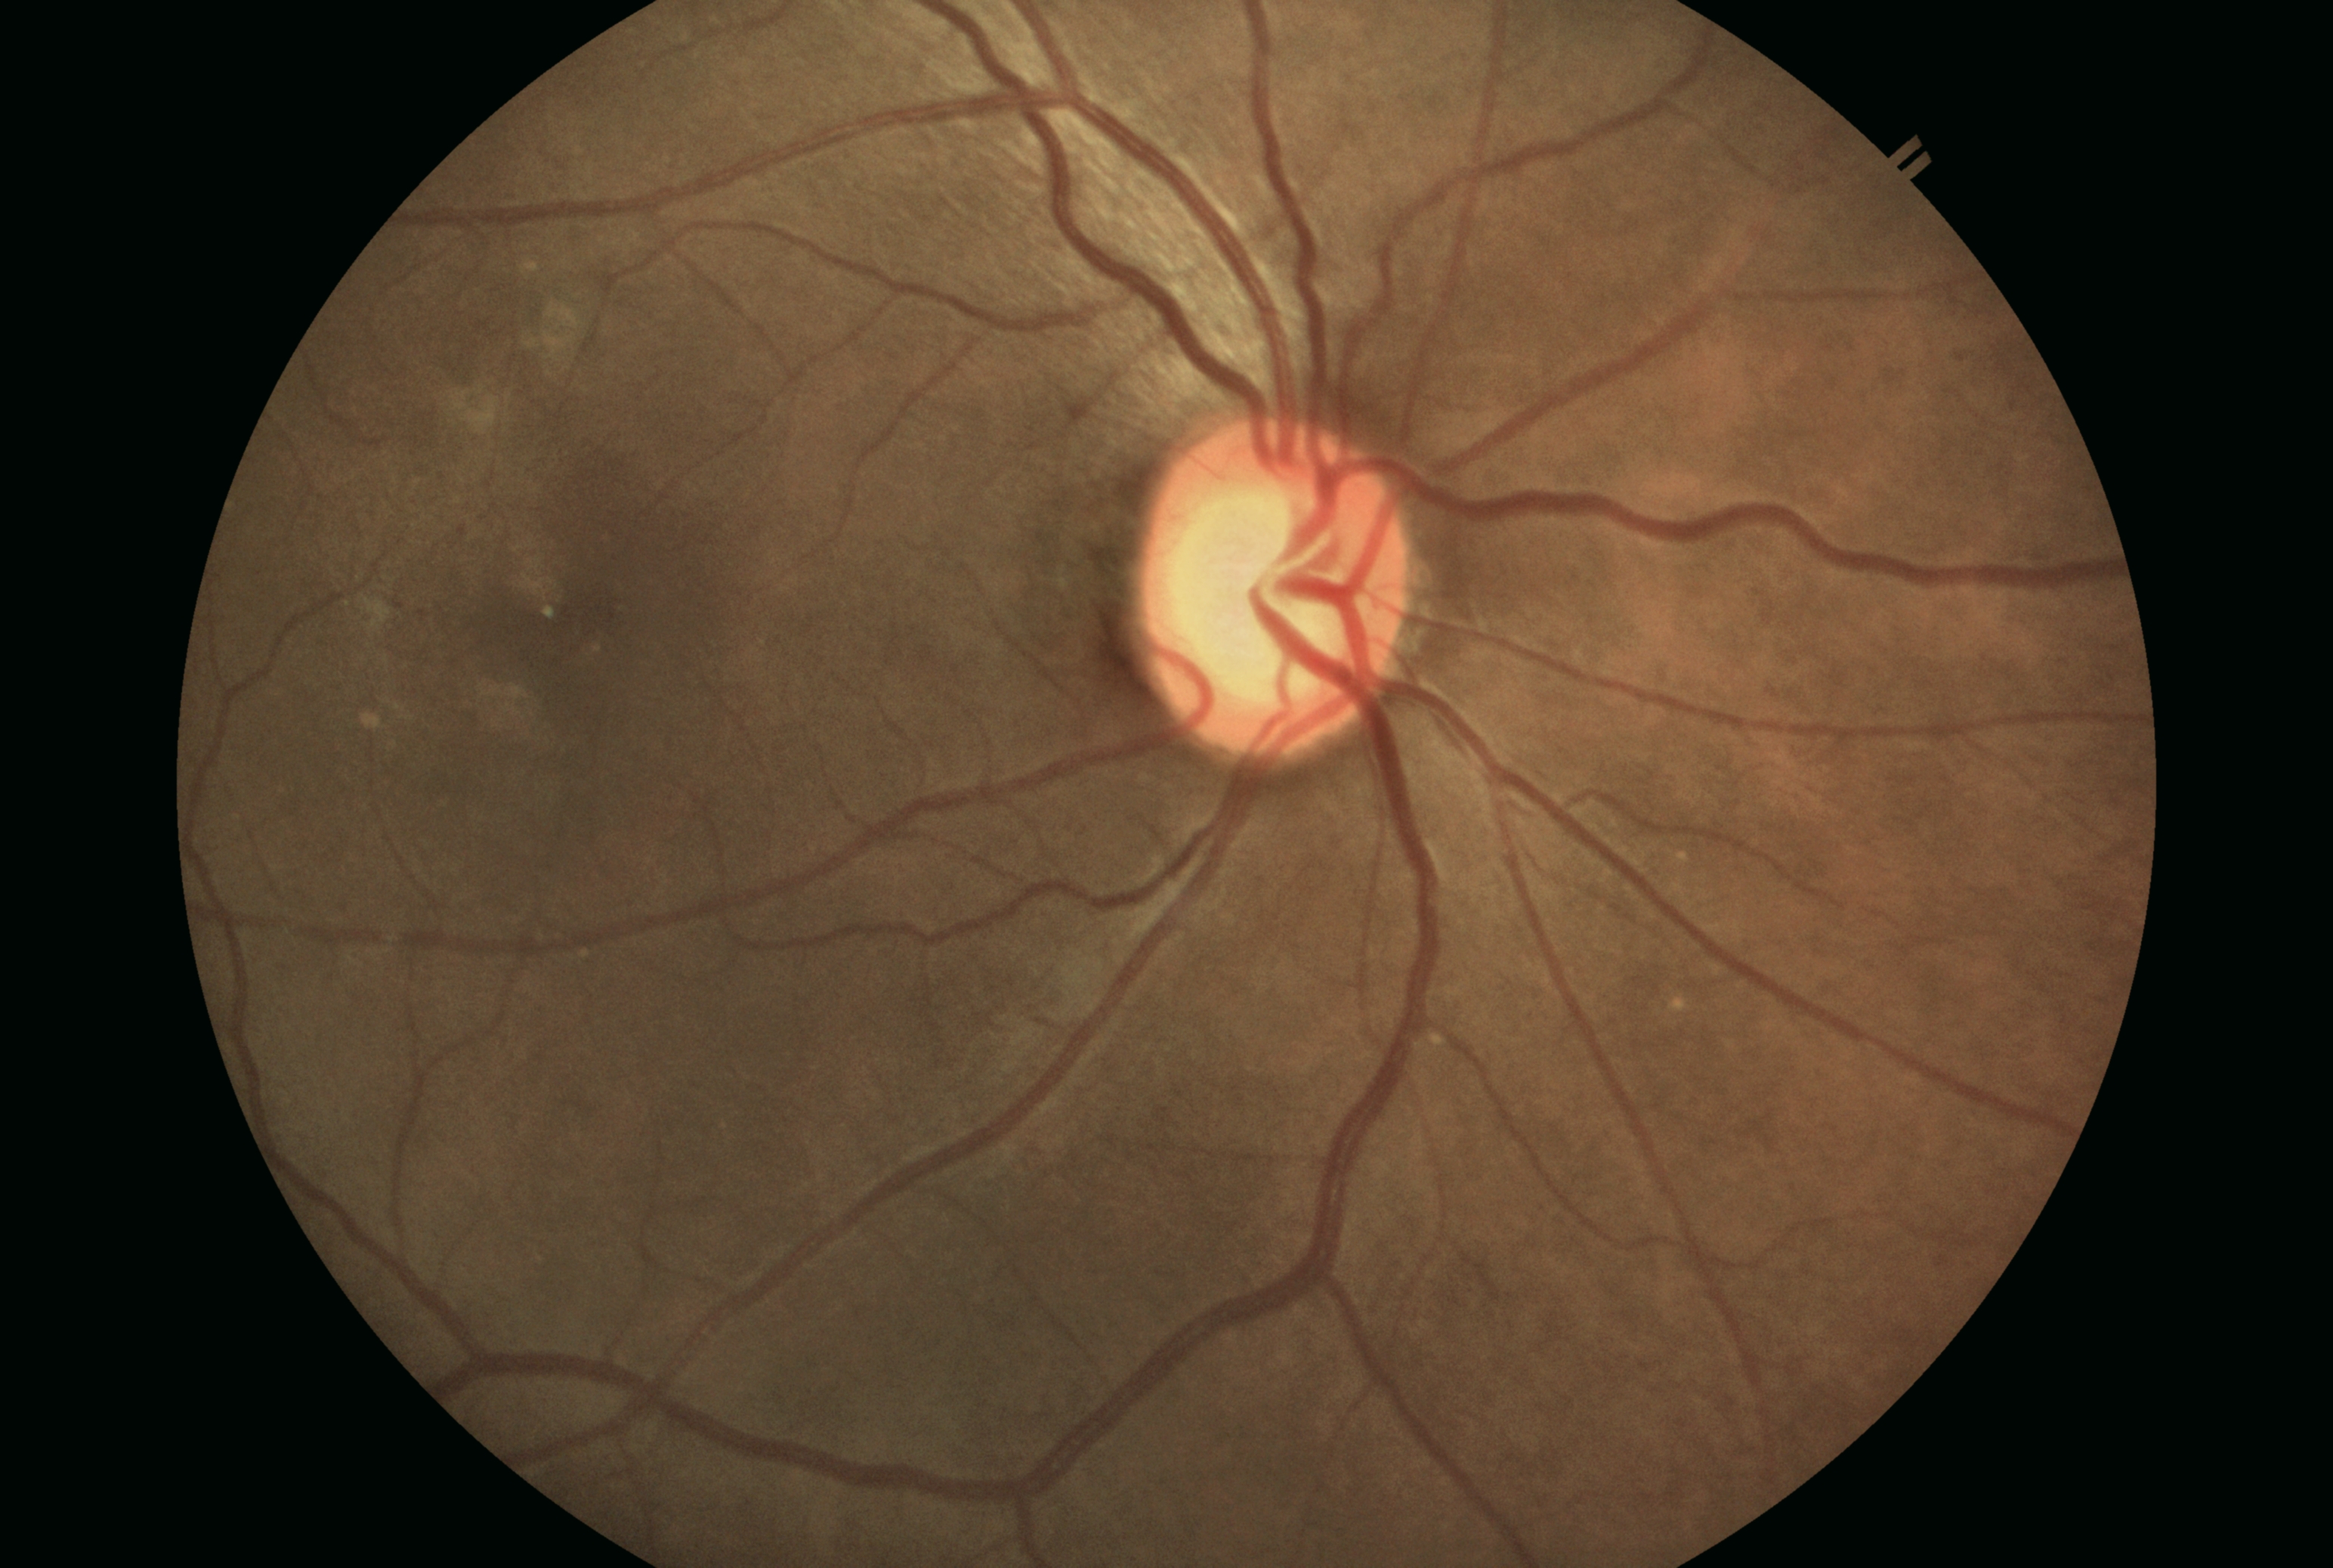
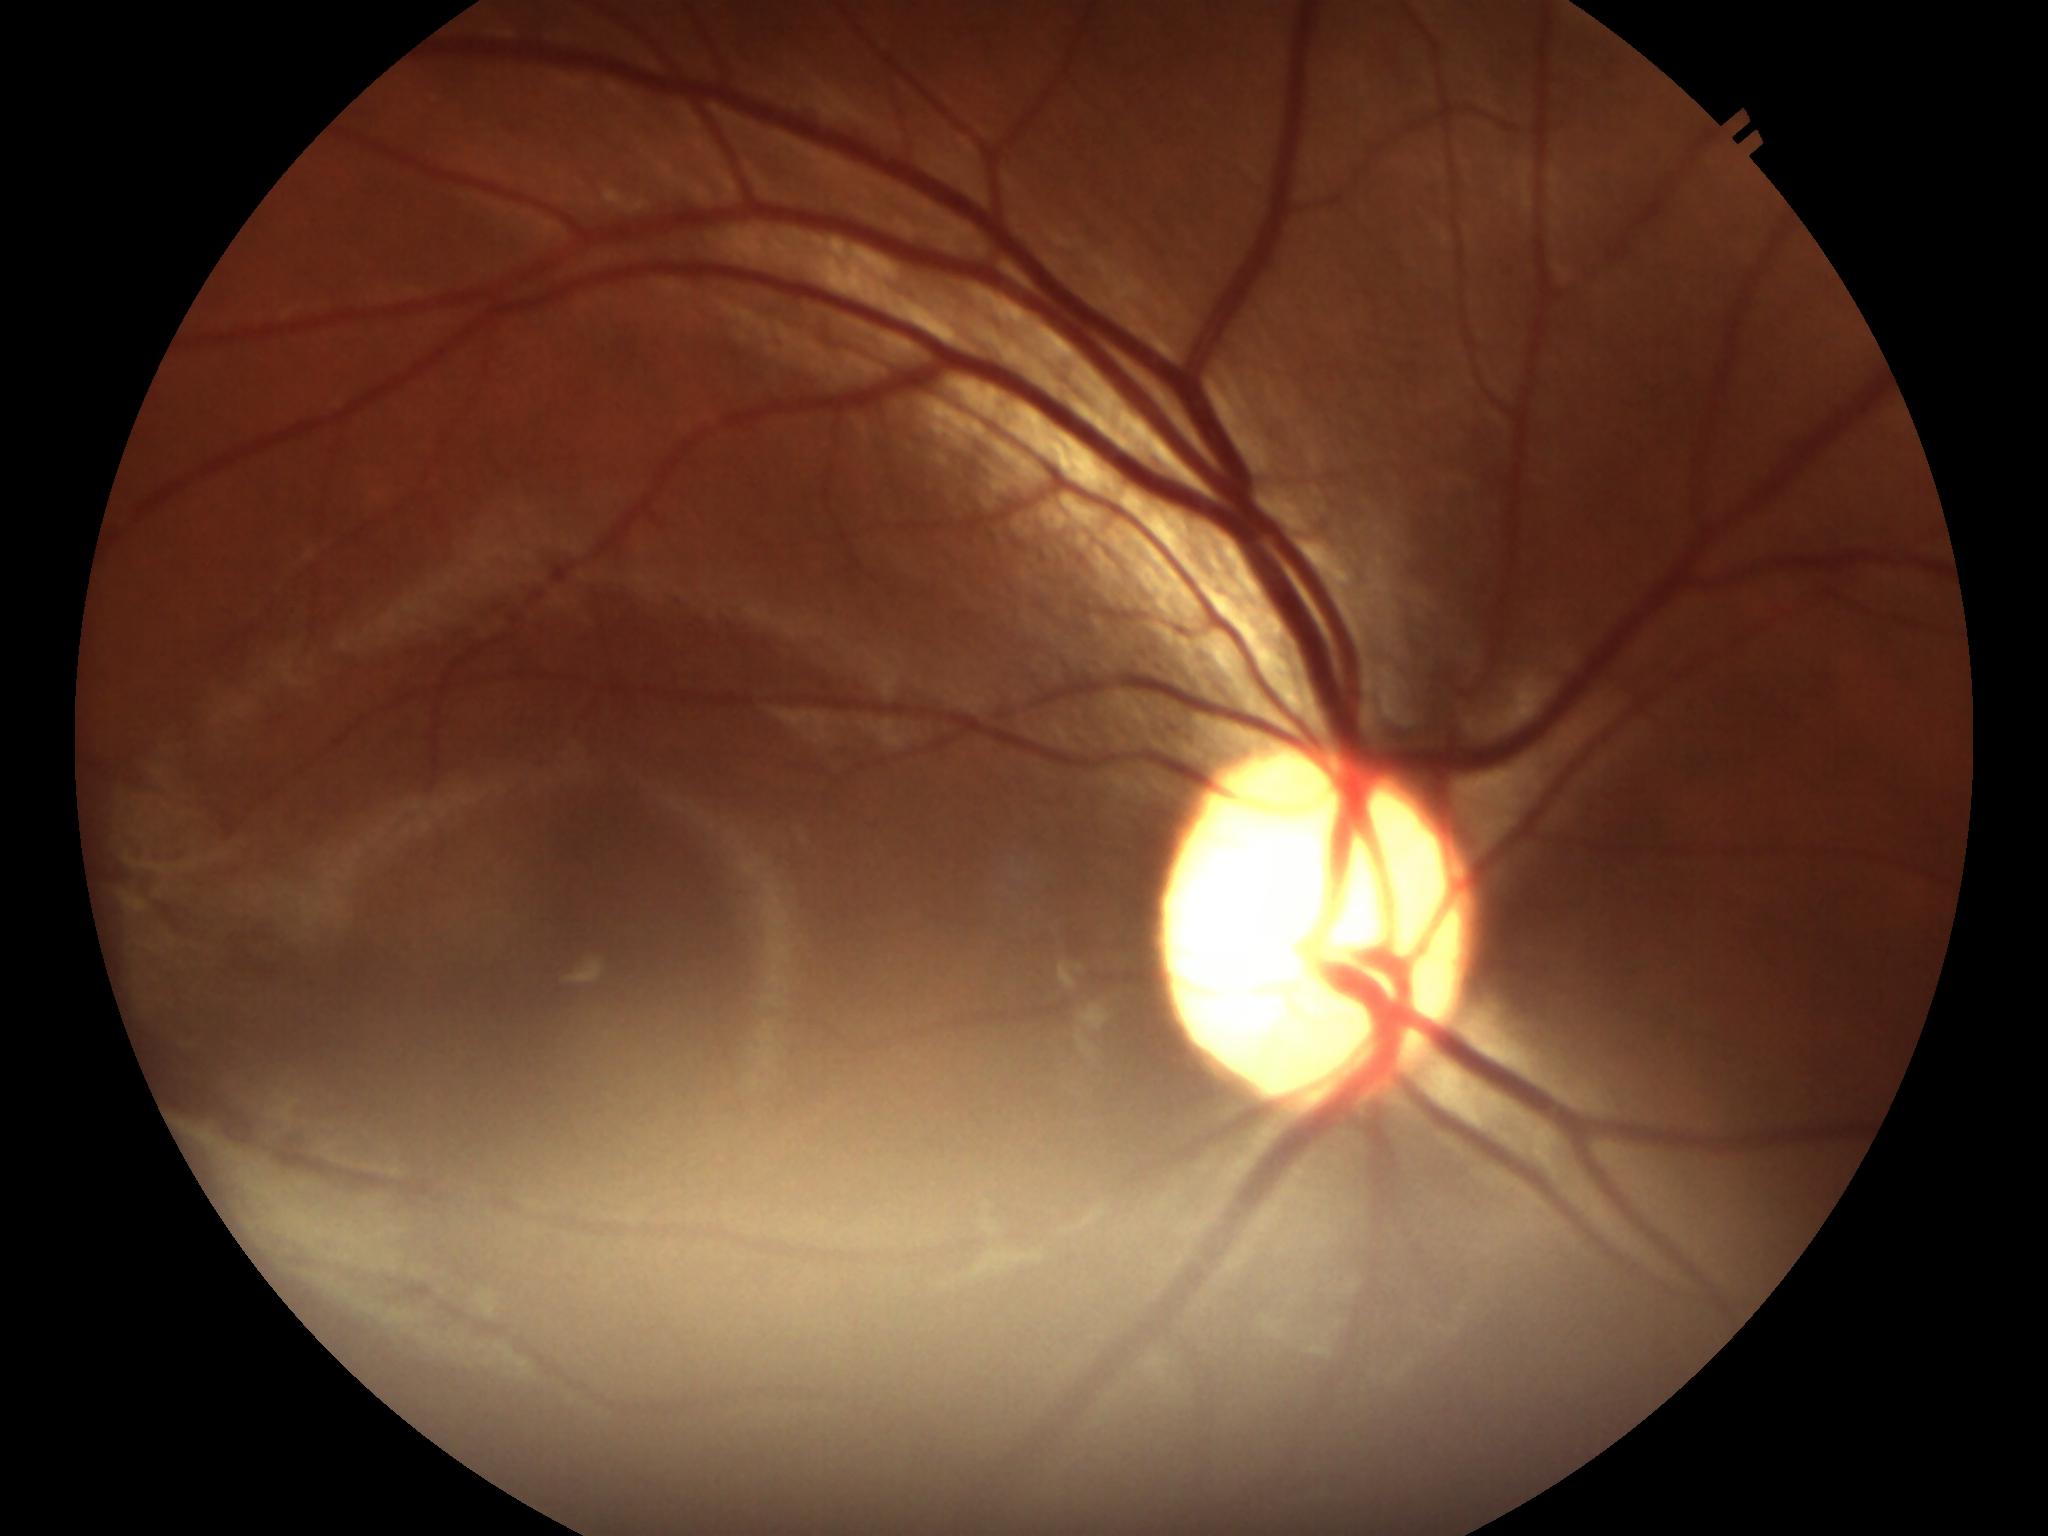
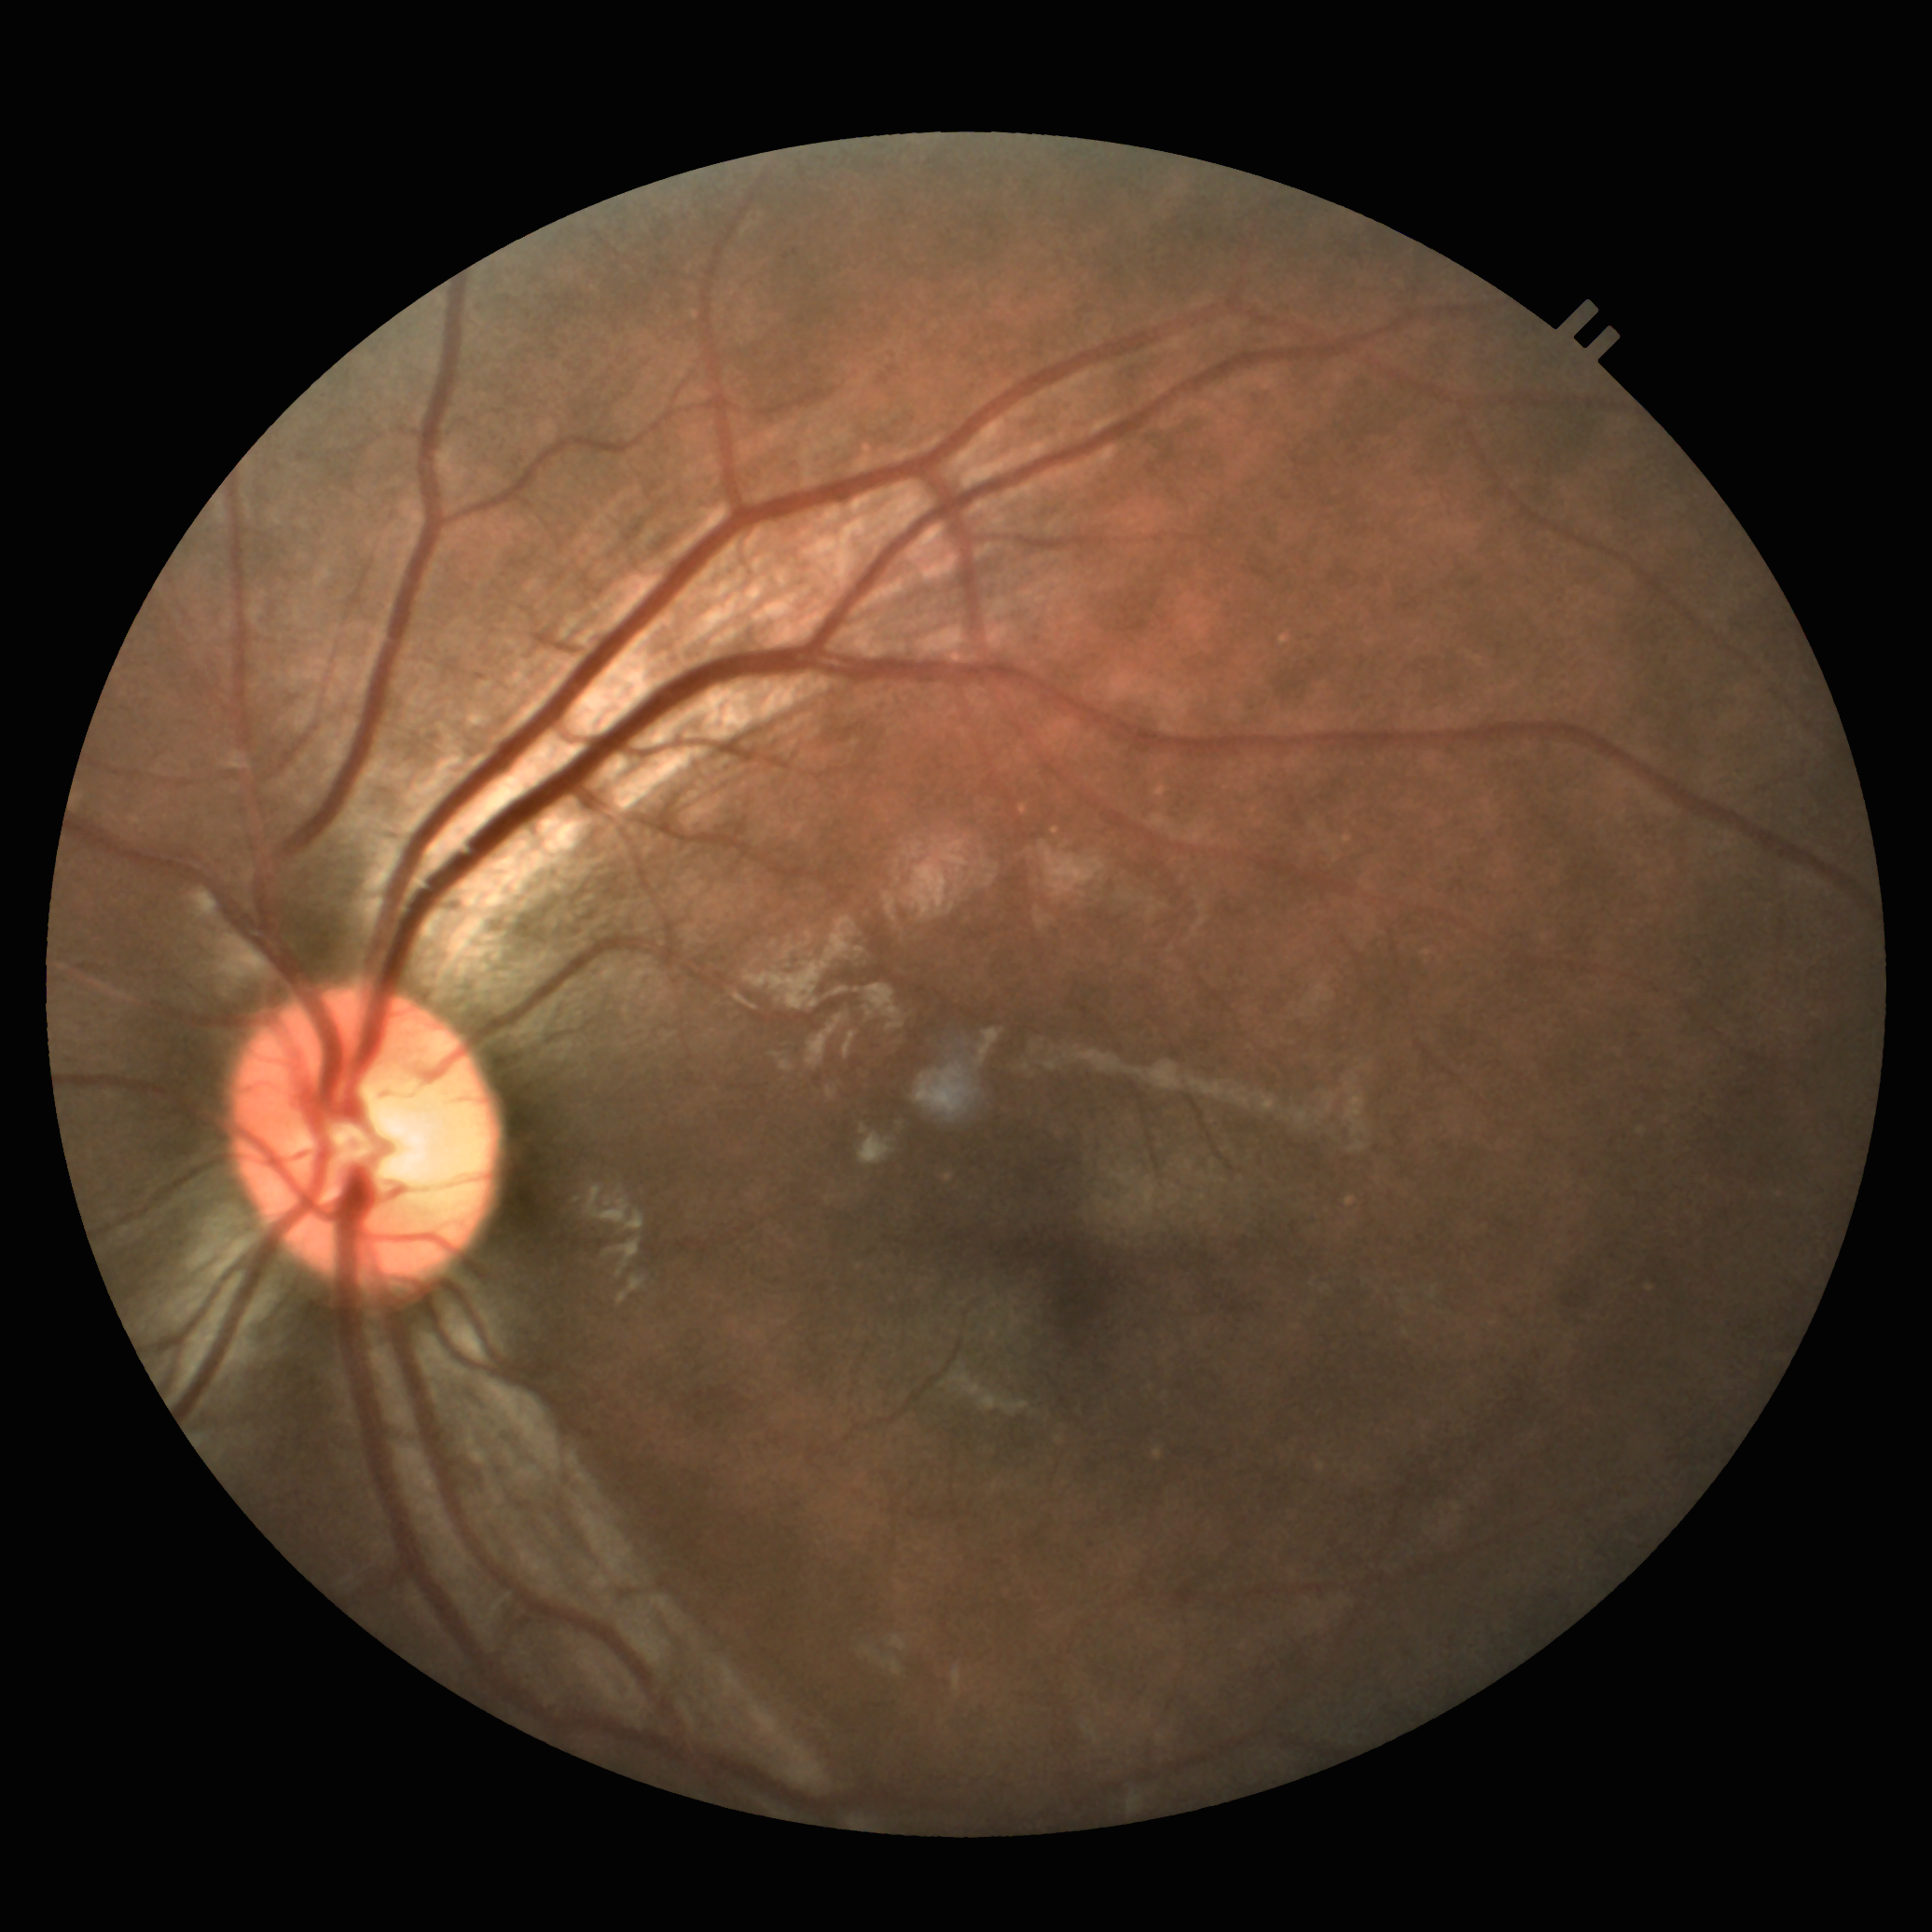
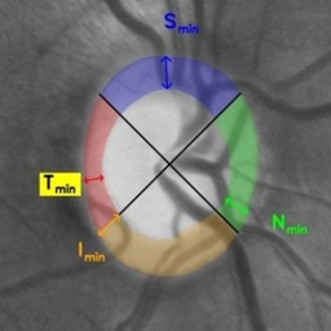
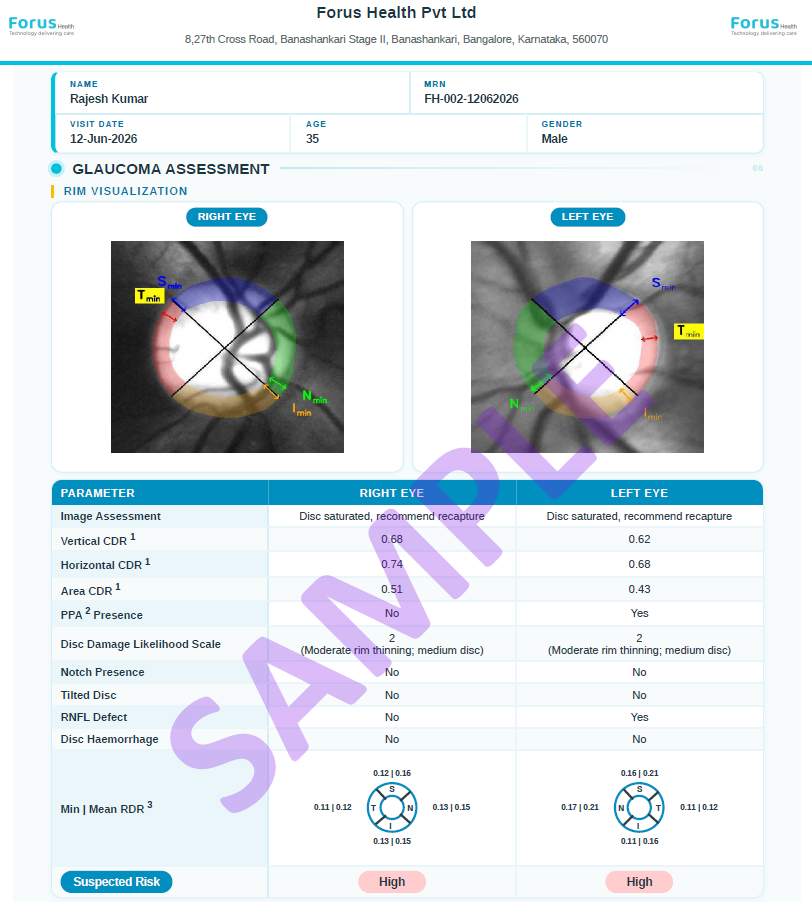
Our Glaucoma Analysis Tools features automatic and precise optic disc and cup segmentation for objective
cup-to-disc ratio estimation. The system comprehensively evaluates the optic nerve head, identifying
critical structural risk factors such as RNFL defects, peripapillary atrophy, disc hemorrhages, and
neuroretinal rim notching. By analyzing these subtle markers of damage, the AI instantly categorizes the
patient's overall risk into three clear, actionable levels: low risk, glaucoma suspect, or high risk. This
automated assessment streamlines early detection and empowers clinical teams to prioritize care where it is
needed most.
Attention U-NetSegmentation +
ClassificationCDR estimationSaMDDDLSNotchRNFL DefectPPA
Retinal SegmentDeployedCDSCO Test License
Age-Related Macular Degeneration
Our AI solution for age-related macular degeneration (AMD) screening is engineered to detect AMD across all
stages - including its earliest onsets. The system analyzes retinal fundus images to precisely identify key
biomarkers of progression, ranging from hard and soft drusen deposits to geographic atrophy (dry AMD) and
choroidal neovascularization (wet AMD). To support clinical decision-making, the AI generates intuitive
heatmaps that visually localize these lesions, ensuring a rapid, objective, and clear assessment that
streamlines patient triage and preserves vision.
EfficientNet-V2Drusen segmentationSaMDDry AMDWet AMD
Anterior SegmentIn Validation
Cataract Detection & Grading
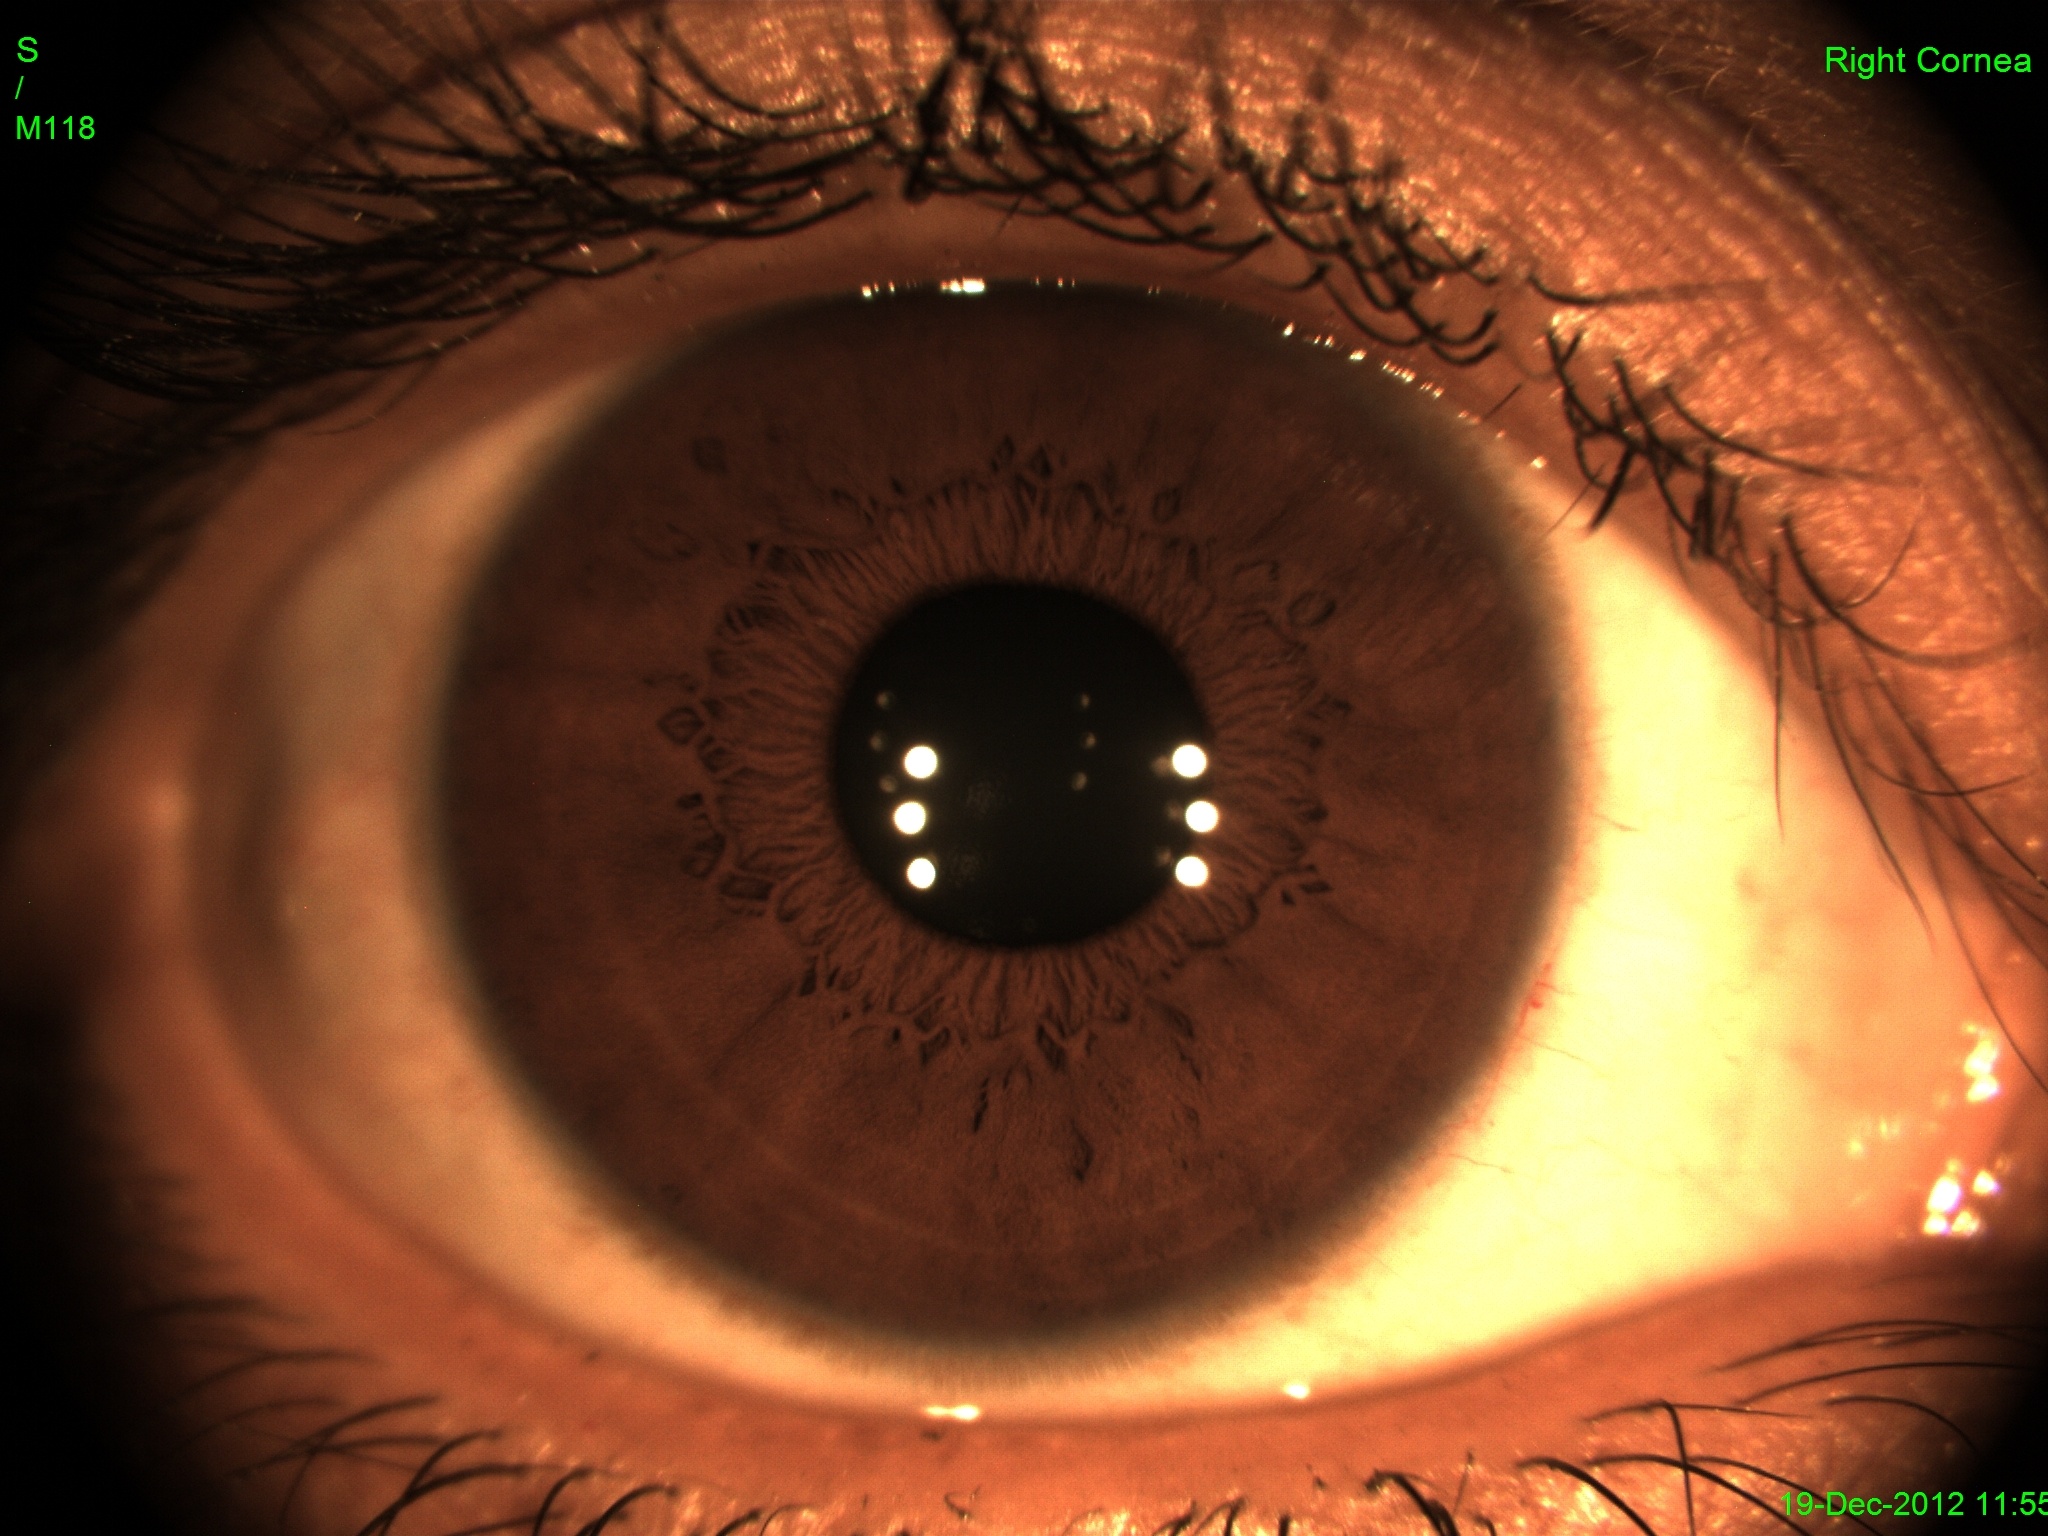
This system is designed to evaluate anterior segment eye images and instantly detect cataract risk. To
ensure complete clinical transparency, the system automatically generates a detailed pupil opacity
representation for at-risk cases, highlighting the exact areas of localized cloudiness within the pupil
region. By delivering this immediate visual evidence directly into clinical workflows, the AI provides
objective validation that streamlines patient education and supports surgical triage.
SaMD
OculomicsIn Validation
Hypertensive Retinopathy
By analyzing subtle microvascular alterations in retinal images, this AI system detects clinical markers
such as arteriovenous nicking, focal arteriolar narrowing, and the classic copper or silver wiring of
arterioles, alongside retinal hemorrhages - and provides heat-map localization for the same. This
automated evaluation provides clinicians with an objective assessment of retinopathy driven by systemic
hypertension.
SaMDAV NickingFlame
hemorrhagesEfficientNet backbone
Anterior SegmentIn Validation
Lipid Layer Thickness (LLT)
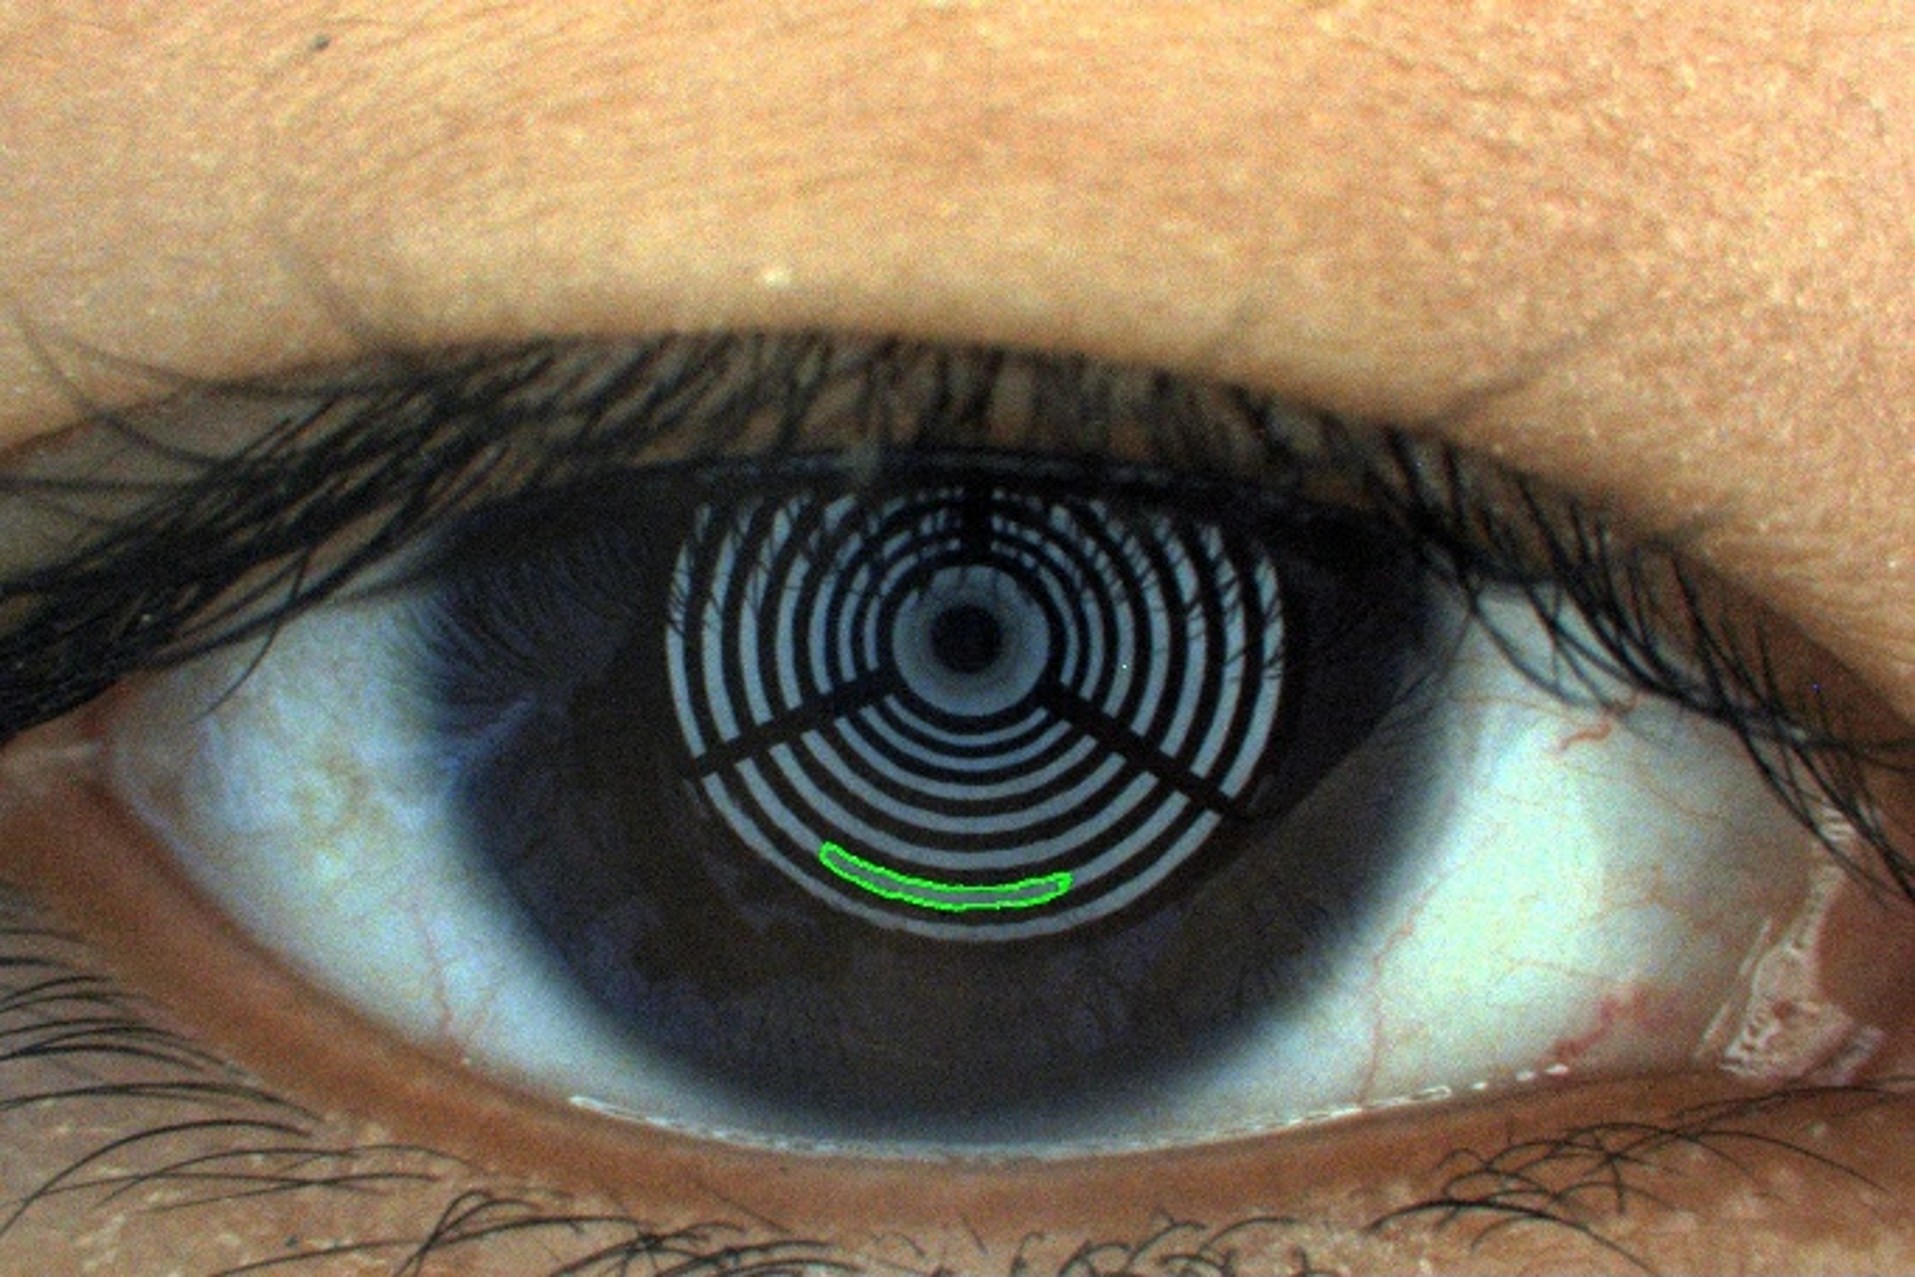
This AI system analyzes a video spanning a few blinks to look for subtle interference fringe patterns
(similar to colors on soap bubbles), within the tear film's lipid layer component to score its thickness.
Furthermore, the system automatically tracks and quantifies patient dynamics - including average blink
frequency and average inter-blink duration - providing clinicians with a comprehensive assessment to guide
personalized treatment strategies.
Fringe pattern analysisSaMDInterferometryBlink detectionVideo
segmentation
Anterior SegmentIn Validation
Tear Meniscus Height (TMH)
This AI solution provides an automated measurement of tear meniscus height from anterior segment images
using semantic segmentation of the tear that pools above the lower eyelid. It provides an objective tear
meniscus height measurement (mm) that serves as a rapid and reliable biomarker for aqueous-deficient dry eye
screening.
Semantic segmentationSaMDTear MeniscusCNN U-Net
Anterior SegmentIn Validation
Meibomian Gland Dysfunction (MGD)
Our Meibomian Gland Dysfunction (MGD) AI solution is designed to automatically segment and quantify gland
morphology from infrared meibography images. The system meticulously computes precise, objective metrics
including gland atrophy percentage, a tortuosity index, and the gland-to-gap ratio, culminating in a
standardized meiboscore. This comprehensive, fully automated assessment transforms complex structural data
into actionable insights that help to detect early meibomian gland loss, track disease progression and
choose appropriate interventions.
Instance segmentationTortuosity
indexSaMDGland atrophyMeiboscoreCNN U-Net
Anterior SegmentIn Validation
Tear Break-Up Time (TBUT)
By leveraging our patented computer vision algorithms, this system automatically segments the cornea into
distinct sectors, tracking micro-fluctuations in the tear film stability and break-up over time. The AI
detects the exact millisecond and precise location of tear film rupture across each zone, mapping
localized evaporation patterns without the need for irritating dyes.
SaMDPatented AIInstance segmentationCNN U-NetSector
break-up chart
Performance figures are rounded aggregates of
multi-site studies, subject to change.